29
/
en
AIzaSyAYiBZKx7MnpbEhh9jyipgxe19OcubqV5w
April 1, 2024
111221
Congo, Rep.
COG
true
2
1
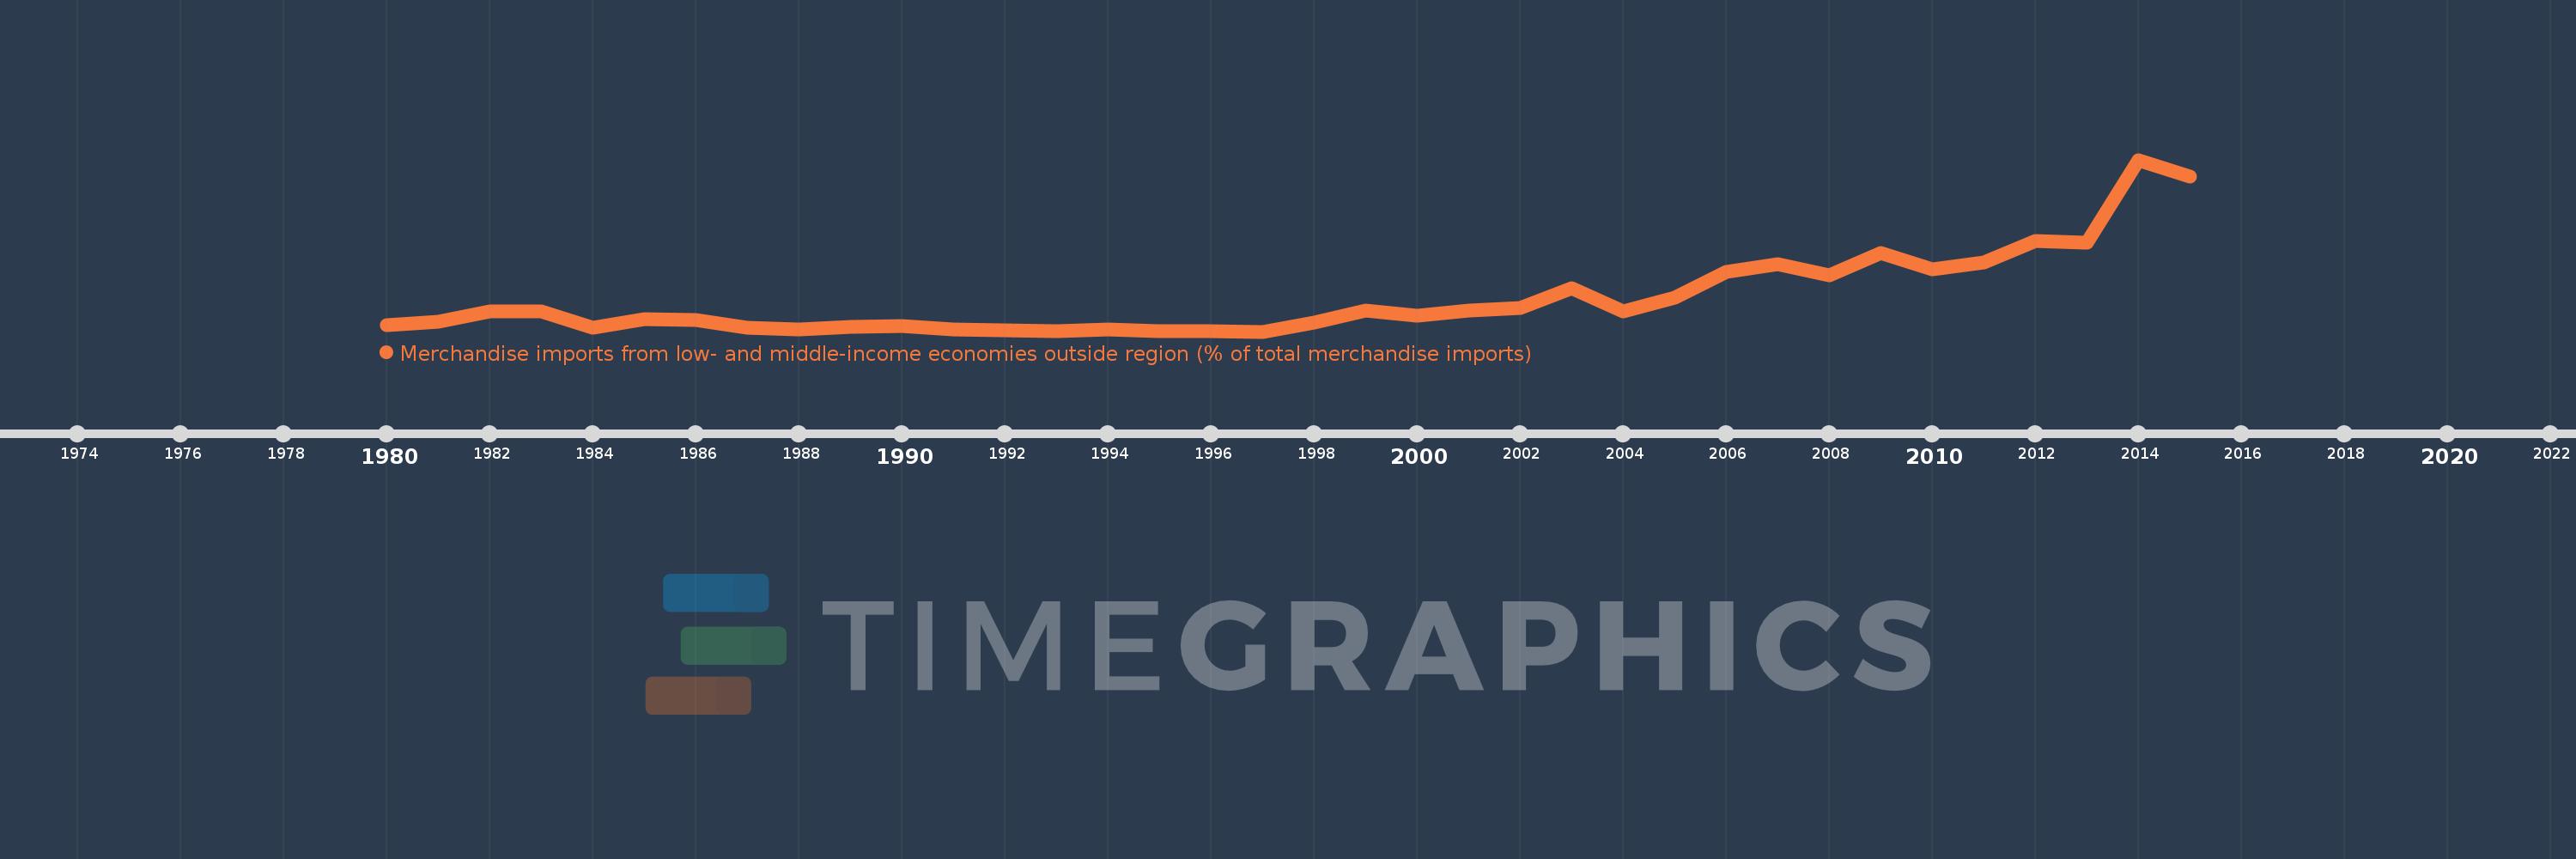
Merchandise imports from low- and middle-income economies outside region (% of total merchandise imports)
2015,2014,2013,2012,2011,2010,2009,2008,2007,2006,2005,2004,2003,2002,2001,2000,1999,1998,1997,1996,1995,1994,1993,1992,1991,1990,1989,1988,1987,1986,1985,1984,1983,1982,1981,1980
This statistics in other country:
AfghanistanAlbaniaAlgeriaAngolaArab WorldArgentinaArmeniaArubaAustraliaAustriaAzerbaijanBahamas, TheBahrainBangladeshBarbadosBelarusBelgiumBelizeBeninBermudaBoliviaBrazilBrunei DarussalamBulgariaBurkina FasoBurundiCabo VerdeCambodiaCameroonCanadaCaribbean small statesCentral African RepublicCentral Europe and the BalticsChileChinaColombiaCongo, Dem. Rep.Congo, Rep.Costa RicaCote d'IvoireCroatiaCubaCyprusCzech RepublicDenmarkDominicaDominican RepublicEarly-demographic dividendEast Asia & PacificEast Asia & Pacific (excluding high income)East Asia & Pacific (IDA & IBRD countries)EcuadorEgypt, Arab Rep.El SalvadorEstoniaEthiopiaEuro areaEurope & Central AsiaEurope & Central Asia (excluding high income)Europe & Central Asia (IDA & IBRD countries)European UnionFijiFinlandFragile and conflict affected situationsFranceGabonGambia, TheGeorgiaGermanyGhanaGreeceGreenlandGrenadaGuatemalaGuineaGuyanaHaitiHeavily indebted poor countries (HIPC)High incomeHondurasHong Kong SAR, ChinaHungaryIBRD onlyIcelandIDA & IBRD totalIDA blendIDA onlyIDA totalIndiaIndonesiaIran, Islamic Rep.IraqIrelandIsraelItalyJamaicaJapanJordanKazakhstanKenyaKorea, Dem. People’s Rep.Korea, Rep.KuwaitKyrgyz RepublicLao PDRLate-demographic dividendLatin America & Caribbean Latin America & Caribbean (excluding high income)Latin America & the Caribbean (IDA & IBRD countries)LatviaLeast developed countries: UN classificationLebanonLiberiaLibyaLithuaniaLow & middle incomeLow incomeLower middle incomeLuxembourgMacao SAR, ChinaMacedonia, FYRMadagascarMalawiMalaysiaMaliMaltaMauritaniaMauritiusMexicoMiddle East & North AfricaMiddle East & North Africa (excluding high income)Middle East & North Africa (IDA & IBRD countries)Middle incomeMoldovaMongoliaMontenegroMoroccoMozambiqueMyanmarNetherlandsNew CaledoniaNew ZealandNicaraguaNigerNigeriaNorth AmericaNorwayOECD membersOmanOther small statesPacific island small statesPakistanPanamaPapua New GuineaParaguayPeruPhilippinesPolandPortugalPost-demographic dividendPre-demographic dividendQatarRomaniaRussian FederationRwandaSaudi ArabiaSenegalSerbiaSeychellesSierra LeoneSingaporeSlovak RepublicSloveniaSmall statesSomaliaSouth AfricaSouth AsiaSouth Asia (IDA & IBRD)SpainSri LankaSt. Kitts and NevisSt. LuciaSt. Vincent and the GrenadinesSub-Saharan Africa Sub-Saharan Africa (excluding high income)Sub-Saharan Africa (IDA & IBRD countries)SudanSurinameSwedenSwitzerlandSyrian Arab RepublicTanzaniaThailandTogoTrinidad and TobagoTunisiaTurkeyUgandaUkraineUnited Arab EmiratesUnited KingdomUnited StatesUpper middle incomeUruguayVenezuela, RBVietnamWorldYemen, Rep.ZambiaZimbabwe Timeline:
This timeline shows a graph from 1980 to 2015 of Congo, Rep.. No data until 1979. Number of actual observations by date: 36.
Source name:
World Development Indicators
Source organization:
World Bank staff estimates based data from International Monetary Fund's Direction of Trade database.
Categories, topics:
Private Sector, Trade
Last updated:
apr 23, 2017
Indicators value changes by year
Maximum:
74.311
jan 1, 2014
At the date of observation
Value
Absolute change
Change from previous value
jan 1, 1980
4.564
+4.564
0.0%
jan 1, 1981
6.191
+1.626
35.63%
jan 1, 1982
10.45
+4.259
68.8%
jan 1, 1983
10.389
-0.061
-0.58%
jan 1, 1984
3.584
-6.804
-65.5%
jan 1, 1985
7.257
+3.673
102.47%
jan 1, 1986
6.881
-0.376
-5.18%
jan 1, 1987
3.473
-3.408
-49.53%
jan 1, 1988
2.803
-0.67
-19.29%
jan 1, 1989
3.891
+1.088
38.82%
jan 1, 1990
4.183
+0.292
7.5%
jan 1, 1991
2.807
-1.376
-32.9%
jan 1, 1992
2.508
-0.299
-10.65%
jan 1, 1993
2.039
-0.469
-18.69%
jan 1, 1994
2.783
+0.744
36.47%
jan 1, 1995
1.961
-0.822
-29.54%
jan 1, 1996
1.985
+0.024
1.23%
jan 1, 1997
1.943
-0.042
-2.1%
jan 1, 1998
5.82
+3.877
199.51%
jan 1, 1999
10.851
+5.03
86.43%
jan 1, 2000
8.589
-2.262
-20.84%
jan 1, 2001
10.96
+2.371
27.61%
jan 1, 2002
11.785
+0.825
7.52%
jan 1, 2003
20.081
+8.296
70.39%
jan 1, 2004
10.603
-9.478
-47.2%
jan 1, 2005
16.238
+5.635
53.14%
jan 1, 2006
27.125
+10.887
67.04%
jan 1, 2007
30.242
+3.117
11.49%
jan 1, 2008
25.734
-4.508
-14.9%
jan 1, 2009
34.942
+9.207
35.78%
jan 1, 2010
28.239
-6.703
-19.18%
jan 1, 2011
30.993
+2.754
9.75%
jan 1, 2012
40.096
+9.103
29.37%
jan 1, 2013
39.325
-0.772
-1.92%
jan 1, 2014
74.311
+34.987
88.97%
jan 1, 2015
67.088
-7.223
-9.72%
Ranking of countries by current statistics by years


Comments: