29
/
en
AIzaSyAYiBZKx7MnpbEhh9jyipgxe19OcubqV5w
April 1, 2024
36778
IBRD only
IBD
false
2
1
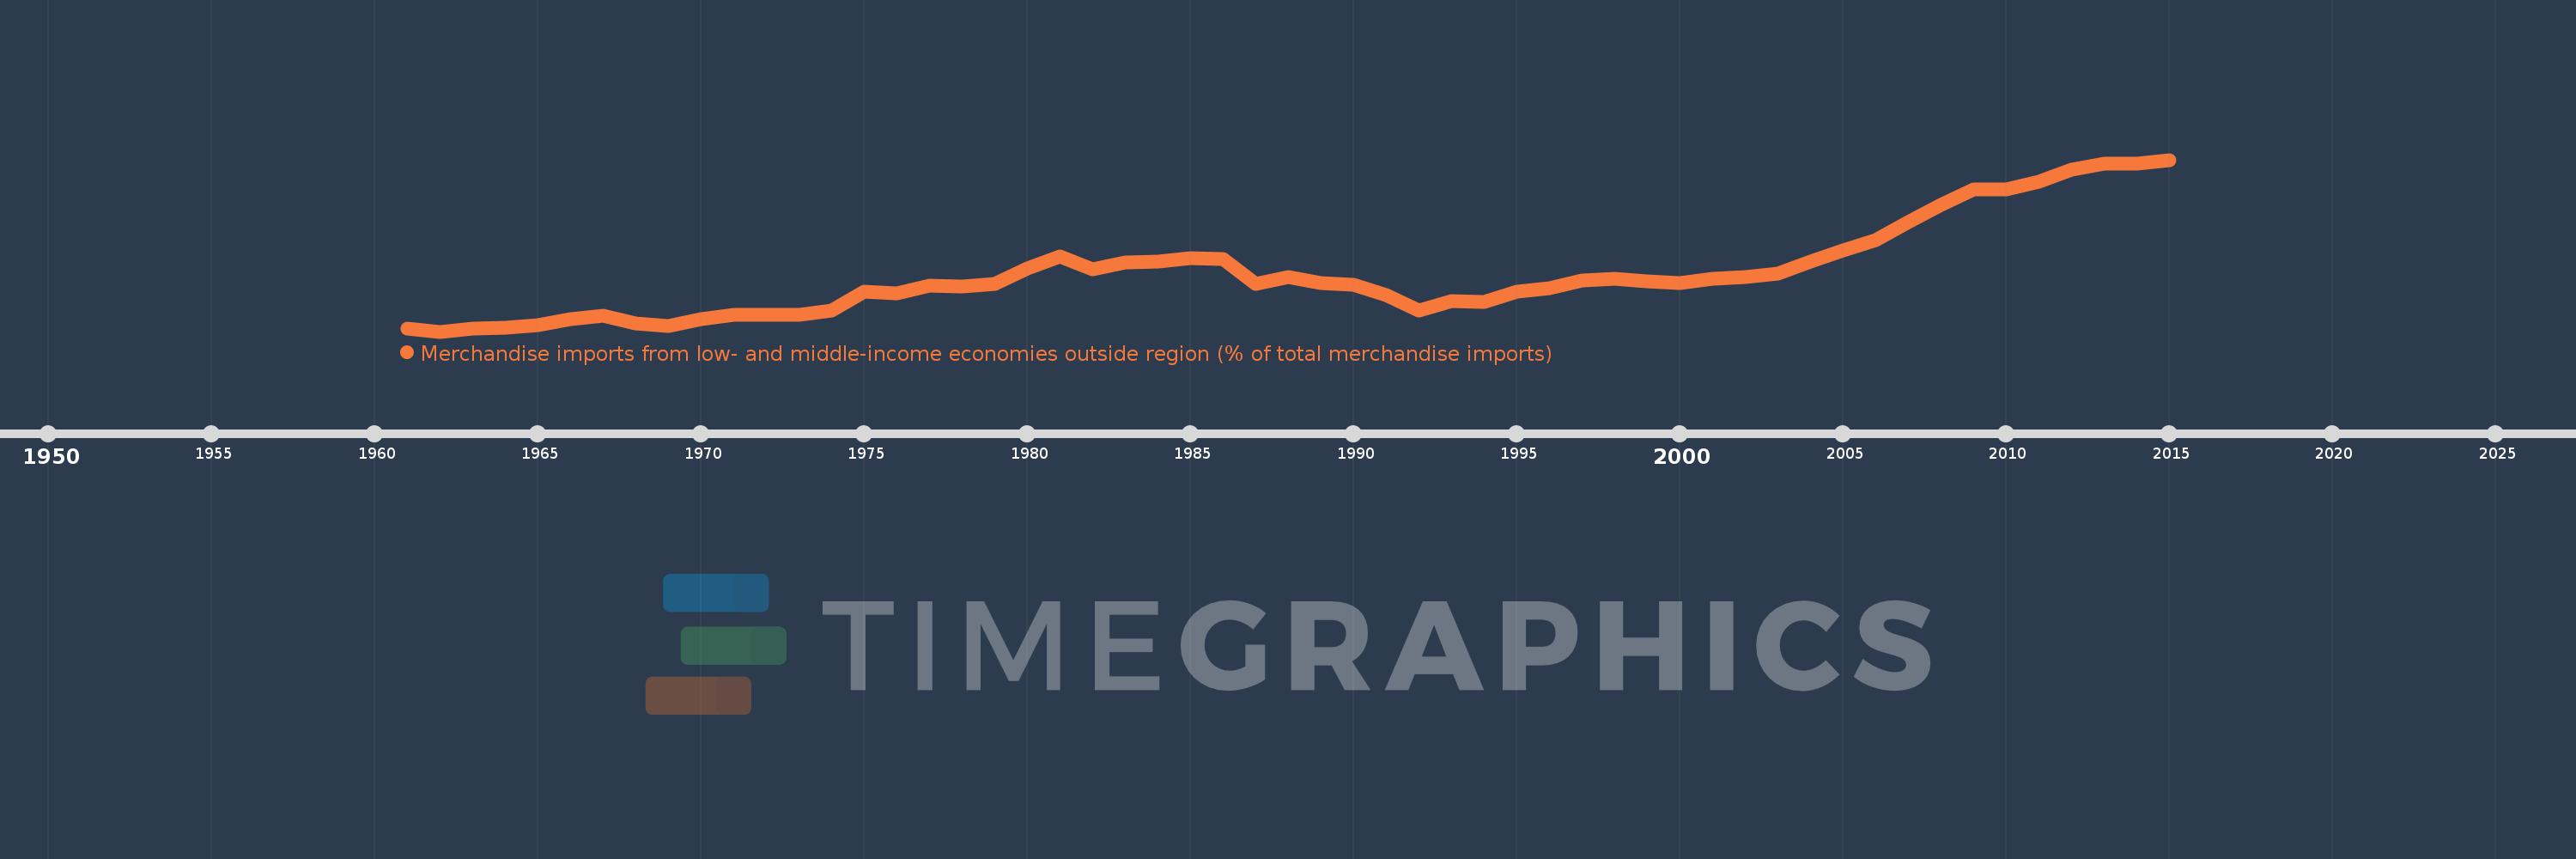
Merchandise imports from low- and middle-income economies outside region (% of total merchandise imports)
2015,2014,2013,2012,2011,2010,2009,2008,2007,2006,2005,2004,2003,2002,2001,2000,1999,1998,1997,1996,1995,1994,1993,1992,1991,1990,1989,1988,1987,1986,1985,1984,1983,1982,1981,1980,1979,1978,1977,1976,1975,1974,1973,1972,1971,1970,1969,1968,1967,1966,1965,1964,1963,1962,1961
This statistics in other country:
AfghanistanAlbaniaAlgeriaAngolaArab WorldArgentinaArmeniaArubaAustraliaAustriaAzerbaijanBahamas, TheBahrainBangladeshBarbadosBelarusBelgiumBelizeBeninBermudaBoliviaBrazilBrunei DarussalamBulgariaBurkina FasoBurundiCabo VerdeCambodiaCameroonCanadaCaribbean small statesCentral African RepublicCentral Europe and the BalticsChileChinaColombiaCongo, Dem. Rep.Congo, Rep.Costa RicaCote d'IvoireCroatiaCubaCyprusCzech RepublicDenmarkDominicaDominican RepublicEarly-demographic dividendEast Asia & PacificEast Asia & Pacific (excluding high income)East Asia & Pacific (IDA & IBRD countries)EcuadorEgypt, Arab Rep.El SalvadorEstoniaEthiopiaEuro areaEurope & Central AsiaEurope & Central Asia (excluding high income)Europe & Central Asia (IDA & IBRD countries)European UnionFijiFinlandFragile and conflict affected situationsFranceGabonGambia, TheGeorgiaGermanyGhanaGreeceGreenlandGrenadaGuatemalaGuineaGuyanaHaitiHeavily indebted poor countries (HIPC)High incomeHondurasHong Kong SAR, ChinaHungaryIBRD onlyIcelandIDA & IBRD totalIDA blendIDA onlyIDA totalIndiaIndonesiaIran, Islamic Rep.IraqIrelandIsraelItalyJamaicaJapanJordanKazakhstanKenyaKorea, Dem. People’s Rep.Korea, Rep.KuwaitKyrgyz RepublicLao PDRLate-demographic dividendLatin America & Caribbean Latin America & Caribbean (excluding high income)Latin America & the Caribbean (IDA & IBRD countries)LatviaLeast developed countries: UN classificationLebanonLiberiaLibyaLithuaniaLow & middle incomeLow incomeLower middle incomeLuxembourgMacao SAR, ChinaMacedonia, FYRMadagascarMalawiMalaysiaMaliMaltaMauritaniaMauritiusMexicoMiddle East & North AfricaMiddle East & North Africa (excluding high income)Middle East & North Africa (IDA & IBRD countries)Middle incomeMoldovaMongoliaMontenegroMoroccoMozambiqueMyanmarNetherlandsNew CaledoniaNew ZealandNicaraguaNigerNigeriaNorth AmericaNorwayOECD membersOmanOther small statesPacific island small statesPakistanPanamaPapua New GuineaParaguayPeruPhilippinesPolandPortugalPost-demographic dividendPre-demographic dividendQatarRomaniaRussian FederationRwandaSaudi ArabiaSenegalSerbiaSeychellesSierra LeoneSingaporeSlovak RepublicSloveniaSmall statesSomaliaSouth AfricaSouth AsiaSouth Asia (IDA & IBRD)SpainSri LankaSt. Kitts and NevisSt. LuciaSt. Vincent and the GrenadinesSub-Saharan Africa Sub-Saharan Africa (excluding high income)Sub-Saharan Africa (IDA & IBRD countries)SudanSurinameSwedenSwitzerlandSyrian Arab RepublicTanzaniaThailandTogoTrinidad and TobagoTunisiaTurkeyUgandaUkraineUnited Arab EmiratesUnited KingdomUnited StatesUpper middle incomeUruguayVenezuela, RBVietnamWorldYemen, Rep.ZambiaZimbabwe Timeline:
This timeline shows a graph from 1961 to 2015 of IBRD only. No data until 1960. Number of actual observations by date: 55.
Source name:
World Development Indicators
Source organization:
World Bank staff estimates based data from International Monetary Fund's Direction of Trade database.
Categories, topics:
Private Sector, Trade
Last updated:
apr 23, 2017
Indicators value changes by year
Maximum:
21.781
jan 1, 2015
At the date of observation
Value
Absolute change
Change from previous value
jan 1, 1961
5.057
+5.057
0.0%
jan 1, 1962
4.722
-0.334
-6.61%
jan 1, 1963
5.04
+0.317
6.72%
jan 1, 1964
5.065
+0.025
0.5%
jan 1, 1965
5.371
+0.306
6.04%
jan 1, 1966
5.987
+0.617
11.49%
jan 1, 1967
6.3
+0.313
5.23%
jan 1, 1968
5.517
-0.783
-12.43%
jan 1, 1969
5.284
-0.233
-4.23%
jan 1, 1970
5.944
+0.66
12.49%
jan 1, 1971
6.35
+0.406
6.83%
jan 1, 1972
6.399
+0.049
0.77%
jan 1, 1973
6.388
-0.011
-0.17%
jan 1, 1974
6.779
+0.391
6.12%
jan 1, 1975
8.679
+1.9
28.03%
jan 1, 1976
8.504
-0.175
-2.01%
jan 1, 1977
9.316
+0.812
9.55%
jan 1, 1978
9.242
-0.074
-0.8%
jan 1, 1979
9.414
+0.172
1.86%
jan 1, 1980
10.95
+1.536
16.31%
jan 1, 1981
12.206
+1.256
11.47%
jan 1, 1982
10.869
-1.337
-10.95%
jan 1, 1983
11.564
+0.695
6.4%
jan 1, 1984
11.69
+0.126
1.09%
jan 1, 1985
11.983
+0.293
2.51%
jan 1, 1986
11.961
-0.022
-0.18%
jan 1, 1987
9.433
-2.528
-21.13%
jan 1, 1988
10.121
+0.687
7.29%
jan 1, 1989
9.573
-0.547
-5.41%
jan 1, 1990
9.377
-0.197
-2.05%
jan 1, 1991
8.355
-1.021
-10.89%
jan 1, 1992
6.834
-1.522
-18.21%
jan 1, 1993
7.782
+0.949
13.88%
jan 1, 1994
7.663
-0.119
-1.53%
jan 1, 1995
8.668
+1.005
13.11%
jan 1, 1996
8.996
+0.328
3.79%
jan 1, 1997
9.813
+0.817
9.08%
jan 1, 1998
9.963
+0.15
1.52%
jan 1, 1999
9.676
-0.287
-2.88%
jan 1, 2000
9.553
-0.123
-1.27%
jan 1, 2001
9.955
+0.401
4.2%
jan 1, 2002
10.179
+0.225
2.26%
jan 1, 2003
10.459
+0.279
2.74%
jan 1, 2004
11.689
+1.231
11.77%
jan 1, 2005
12.762
+1.072
9.17%
jan 1, 2006
13.842
+1.08
8.47%
jan 1, 2007
15.623
+1.781
12.87%
jan 1, 2008
17.293
+1.67
10.69%
jan 1, 2009
18.866
+1.572
9.09%
jan 1, 2010
18.836
-0.03
-0.16%
jan 1, 2011
19.582
+0.746
3.96%
jan 1, 2012
20.782
+1.2
6.13%
jan 1, 2013
21.422
+0.64
3.08%
jan 1, 2014
21.397
-0.025
-0.12%
jan 1, 2015
21.781
+0.384
1.8%
Ranking of countries by current statistics by years


Comments: