29
/
en
AIzaSyAYiBZKx7MnpbEhh9jyipgxe19OcubqV5w
April 1, 2024
44447
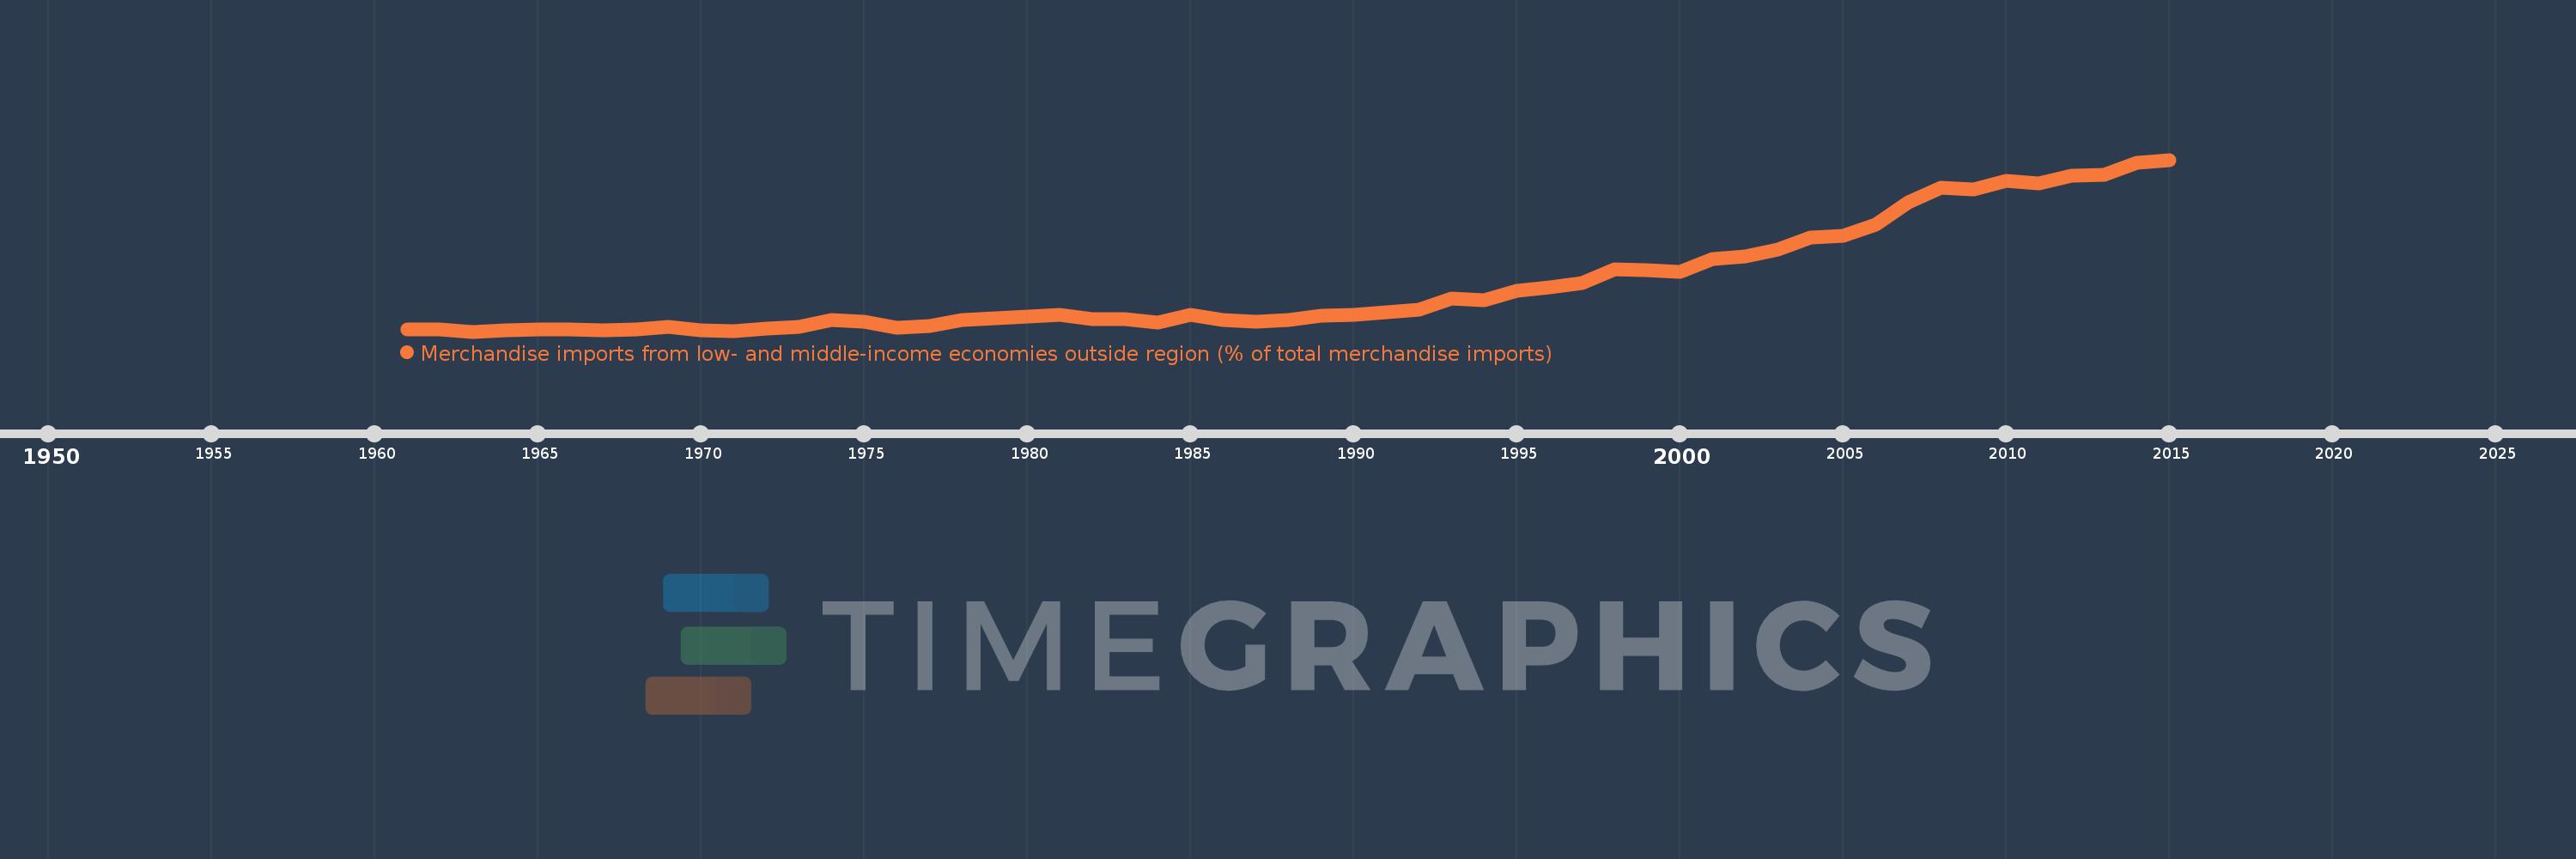
Least developed countries: UN classification
LDC
false
2
1
Merchandise imports from low- and middle-income economies outside region (% of total merchandise imports)
2015,2014,2013,2012,2011,2010,2009,2008,2007,2006,2005,2004,2003,2002,2001,2000,1999,1998,1997,1996,1995,1994,1993,1992,1991,1990,1989,1988,1987,1986,1985,1984,1983,1982,1981,1980,1979,1978,1977,1976,1975,1974,1973,1972,1971,1970,1969,1968,1967,1966,1965,1964,1963,1962,1961
This statistics in other country:
AfghanistanAlbaniaAlgeriaAngolaArab WorldArgentinaArmeniaArubaAustraliaAustriaAzerbaijanBahamas, TheBahrainBangladeshBarbadosBelarusBelgiumBelizeBeninBermudaBoliviaBrazilBrunei DarussalamBulgariaBurkina FasoBurundiCabo VerdeCambodiaCameroonCanadaCaribbean small statesCentral African RepublicCentral Europe and the BalticsChileChinaColombiaCongo, Dem. Rep.Congo, Rep.Costa RicaCote d'IvoireCroatiaCubaCyprusCzech RepublicDenmarkDominicaDominican RepublicEarly-demographic dividendEast Asia & PacificEast Asia & Pacific (excluding high income)East Asia & Pacific (IDA & IBRD countries)EcuadorEgypt, Arab Rep.El SalvadorEstoniaEthiopiaEuro areaEurope & Central AsiaEurope & Central Asia (excluding high income)Europe & Central Asia (IDA & IBRD countries)European UnionFijiFinlandFragile and conflict affected situationsFranceGabonGambia, TheGeorgiaGermanyGhanaGreeceGreenlandGrenadaGuatemalaGuineaGuyanaHaitiHeavily indebted poor countries (HIPC)High incomeHondurasHong Kong SAR, ChinaHungaryIBRD onlyIcelandIDA & IBRD totalIDA blendIDA onlyIDA totalIndiaIndonesiaIran, Islamic Rep.IraqIrelandIsraelItalyJamaicaJapanJordanKazakhstanKenyaKorea, Dem. People’s Rep.Korea, Rep.KuwaitKyrgyz RepublicLao PDRLate-demographic dividendLatin America & Caribbean Latin America & Caribbean (excluding high income)Latin America & the Caribbean (IDA & IBRD countries)LatviaLeast developed countries: UN classificationLebanonLiberiaLibyaLithuaniaLow & middle incomeLow incomeLower middle incomeLuxembourgMacao SAR, ChinaMacedonia, FYRMadagascarMalawiMalaysiaMaliMaltaMauritaniaMauritiusMexicoMiddle East & North AfricaMiddle East & North Africa (excluding high income)Middle East & North Africa (IDA & IBRD countries)Middle incomeMoldovaMongoliaMontenegroMoroccoMozambiqueMyanmarNetherlandsNew CaledoniaNew ZealandNicaraguaNigerNigeriaNorth AmericaNorwayOECD membersOmanOther small statesPacific island small statesPakistanPanamaPapua New GuineaParaguayPeruPhilippinesPolandPortugalPost-demographic dividendPre-demographic dividendQatarRomaniaRussian FederationRwandaSaudi ArabiaSenegalSerbiaSeychellesSierra LeoneSingaporeSlovak RepublicSloveniaSmall statesSomaliaSouth AfricaSouth AsiaSouth Asia (IDA & IBRD)SpainSri LankaSt. Kitts and NevisSt. LuciaSt. Vincent and the GrenadinesSub-Saharan Africa Sub-Saharan Africa (excluding high income)Sub-Saharan Africa (IDA & IBRD countries)SudanSurinameSwedenSwitzerlandSyrian Arab RepublicTanzaniaThailandTogoTrinidad and TobagoTunisiaTurkeyUgandaUkraineUnited Arab EmiratesUnited KingdomUnited StatesUpper middle incomeUruguayVenezuela, RBVietnamWorldYemen, Rep.ZambiaZimbabwe Timeline:
This timeline shows a graph from 1961 to 2015 of Least developed countries: UN classification. No data until 1960. Number of actual observations by date: 55.
Source name:
World Development Indicators
Source organization:
World Bank staff estimates based data from International Monetary Fund's Direction of Trade database.
Categories, topics:
Private Sector, Trade
Last updated:
apr 23, 2017
Indicators value changes by year
Maximum:
29.349
jan 1, 2015
At the date of observation
Value
Absolute change
Change from previous value
jan 1, 1961
1.179
+1.179
0.0%
jan 1, 1962
1.196
+0.017
1.43%
jan 1, 1963
0.81
-0.385
-32.22%
jan 1, 1964
0.996
+0.186
22.9%
jan 1, 1965
1.152
+0.156
15.62%
jan 1, 1966
1.119
-0.032
-2.82%
jan 1, 1967
0.953
-0.166
-14.82%
jan 1, 1968
1.135
+0.181
19.01%
jan 1, 1969
1.537
+0.402
35.42%
jan 1, 1970
1.019
-0.517
-33.65%
jan 1, 1971
0.881
-0.138
-13.57%
jan 1, 1972
1.243
+0.362
41.13%
jan 1, 1973
1.571
+0.327
26.31%
jan 1, 1974
2.725
+1.154
73.5%
jan 1, 1975
2.449
-0.276
-10.14%
jan 1, 1976
1.405
-1.044
-42.63%
jan 1, 1977
1.715
+0.31
22.07%
jan 1, 1978
2.705
+0.99
57.75%
jan 1, 1979
3.029
+0.324
11.99%
jan 1, 1980
3.378
+0.349
11.51%
jan 1, 1981
3.591
+0.213
6.31%
jan 1, 1982
2.877
-0.714
-19.88%
jan 1, 1983
2.833
-0.044
-1.53%
jan 1, 1984
2.299
-0.535
-18.88%
jan 1, 1985
3.576
+1.278
55.58%
jan 1, 1986
2.772
-0.804
-22.48%
jan 1, 1987
2.516
-0.256
-9.24%
jan 1, 1988
2.706
+0.19
7.55%
jan 1, 1989
3.439
+0.733
27.08%
jan 1, 1990
3.626
+0.187
5.44%
jan 1, 1991
4.033
+0.407
11.23%
jan 1, 1992
4.38
+0.346
8.59%
jan 1, 1993
6.336
+1.956
44.66%
jan 1, 1994
6.024
-0.312
-4.92%
jan 1, 1995
7.588
+1.564
25.96%
jan 1, 1996
8.124
+0.536
7.07%
jan 1, 1997
8.878
+0.754
9.28%
jan 1, 1998
11.147
+2.269
25.56%
jan 1, 1999
10.954
-0.192
-1.73%
jan 1, 2000
10.764
-0.19
-1.74%
jan 1, 2001
12.844
+2.08
19.33%
jan 1, 2002
13.291
+0.446
3.47%
jan 1, 2003
14.39
+1.099
8.27%
jan 1, 2004
16.479
+2.089
14.52%
jan 1, 2005
16.726
+0.247
1.5%
jan 1, 2006
18.586
+1.86
11.12%
jan 1, 2007
22.259
+3.673
19.76%
jan 1, 2008
24.736
+2.477
11.13%
jan 1, 2009
24.367
-0.369
-1.49%
jan 1, 2010
25.805
+1.439
5.9%
jan 1, 2011
25.402
-0.403
-1.56%
jan 1, 2012
26.744
+1.342
5.28%
jan 1, 2013
26.903
+0.159
0.59%
jan 1, 2014
28.92
+2.018
7.5%
jan 1, 2015
29.349
+0.429
1.48%
Ranking of countries by current statistics by years


Comments: