29
/
en
AIzaSyAYiBZKx7MnpbEhh9jyipgxe19OcubqV5w
April 1, 2024
119173
Denmark
DNK
true
2
1
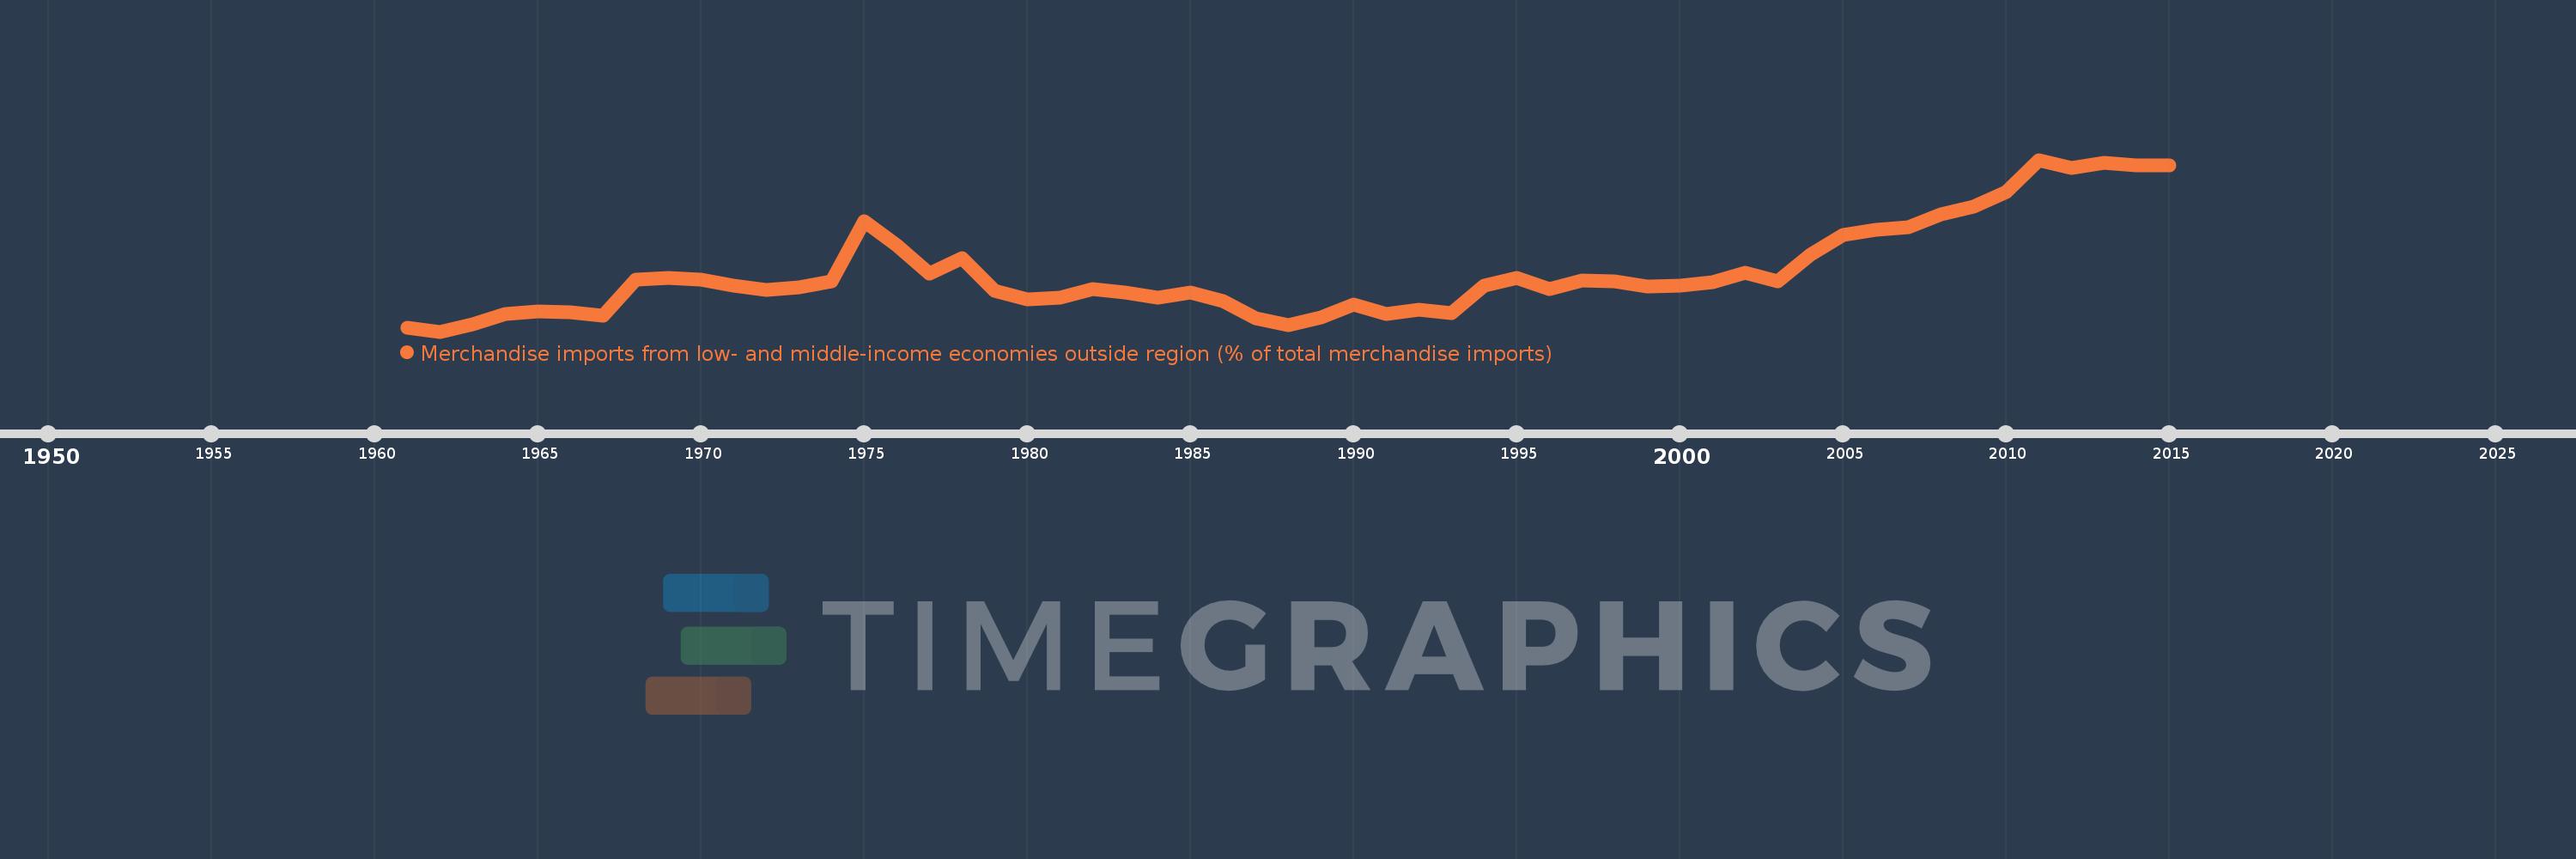
Merchandise imports from low- and middle-income economies outside region (% of total merchandise imports)
2015,2014,2013,2012,2011,2010,2009,2008,2007,2006,2005,2004,2003,2002,2001,2000,1999,1998,1997,1996,1995,1994,1993,1992,1991,1990,1989,1988,1987,1986,1985,1984,1983,1982,1981,1980,1979,1978,1977,1976,1975,1974,1973,1972,1971,1970,1969,1968,1967,1966,1965,1964,1963,1962,1961
This statistics in other country:
AfghanistanAlbaniaAlgeriaAngolaArab WorldArgentinaArmeniaArubaAustraliaAustriaAzerbaijanBahamas, TheBahrainBangladeshBarbadosBelarusBelgiumBelizeBeninBermudaBoliviaBrazilBrunei DarussalamBulgariaBurkina FasoBurundiCabo VerdeCambodiaCameroonCanadaCaribbean small statesCentral African RepublicCentral Europe and the BalticsChileChinaColombiaCongo, Dem. Rep.Congo, Rep.Costa RicaCote d'IvoireCroatiaCubaCyprusCzech RepublicDenmarkDominicaDominican RepublicEarly-demographic dividendEast Asia & PacificEast Asia & Pacific (excluding high income)East Asia & Pacific (IDA & IBRD countries)EcuadorEgypt, Arab Rep.El SalvadorEstoniaEthiopiaEuro areaEurope & Central AsiaEurope & Central Asia (excluding high income)Europe & Central Asia (IDA & IBRD countries)European UnionFijiFinlandFragile and conflict affected situationsFranceGabonGambia, TheGeorgiaGermanyGhanaGreeceGreenlandGrenadaGuatemalaGuineaGuyanaHaitiHeavily indebted poor countries (HIPC)High incomeHondurasHong Kong SAR, ChinaHungaryIBRD onlyIcelandIDA & IBRD totalIDA blendIDA onlyIDA totalIndiaIndonesiaIran, Islamic Rep.IraqIrelandIsraelItalyJamaicaJapanJordanKazakhstanKenyaKorea, Dem. People’s Rep.Korea, Rep.KuwaitKyrgyz RepublicLao PDRLate-demographic dividendLatin America & Caribbean Latin America & Caribbean (excluding high income)Latin America & the Caribbean (IDA & IBRD countries)LatviaLeast developed countries: UN classificationLebanonLiberiaLibyaLithuaniaLow & middle incomeLow incomeLower middle incomeLuxembourgMacao SAR, ChinaMacedonia, FYRMadagascarMalawiMalaysiaMaliMaltaMauritaniaMauritiusMexicoMiddle East & North AfricaMiddle East & North Africa (excluding high income)Middle East & North Africa (IDA & IBRD countries)Middle incomeMoldovaMongoliaMontenegroMoroccoMozambiqueMyanmarNetherlandsNew CaledoniaNew ZealandNicaraguaNigerNigeriaNorth AmericaNorwayOECD membersOmanOther small statesPacific island small statesPakistanPanamaPapua New GuineaParaguayPeruPhilippinesPolandPortugalPost-demographic dividendPre-demographic dividendQatarRomaniaRussian FederationRwandaSaudi ArabiaSenegalSerbiaSeychellesSierra LeoneSingaporeSlovak RepublicSloveniaSmall statesSomaliaSouth AfricaSouth AsiaSouth Asia (IDA & IBRD)SpainSri LankaSt. Kitts and NevisSt. LuciaSt. Vincent and the GrenadinesSub-Saharan Africa Sub-Saharan Africa (excluding high income)Sub-Saharan Africa (IDA & IBRD countries)SudanSurinameSwedenSwitzerlandSyrian Arab RepublicTanzaniaThailandTogoTrinidad and TobagoTunisiaTurkeyUgandaUkraineUnited Arab EmiratesUnited KingdomUnited StatesUpper middle incomeUruguayVenezuela, RBVietnamWorldYemen, Rep.ZambiaZimbabwe Timeline:
This timeline shows a graph from 1961 to 2015 of Denmark. No data until 1960. Number of actual observations by date: 55.
Source name:
World Development Indicators
Source organization:
World Bank staff estimates based data from International Monetary Fund's Direction of Trade database.
Categories, topics:
Private Sector, Trade
Last updated:
apr 23, 2017
Indicators value changes by year
At the date of observation
Value
Absolute change
Change from previous value
jan 1, 1961
4.545
+4.545
0.0%
jan 1, 1962
4.363
-0.182
-3.99%
jan 1, 1963
4.728
+0.365
8.36%
jan 1, 1964
5.269
+0.541
11.44%
jan 1, 1965
5.391
+0.122
2.32%
jan 1, 1966
5.338
-0.053
-0.99%
jan 1, 1967
5.169
-0.169
-3.16%
jan 1, 1968
7.01
+1.841
35.63%
jan 1, 1969
7.106
+0.095
1.36%
jan 1, 1970
7.016
-0.089
-1.26%
jan 1, 1971
6.724
-0.293
-4.17%
jan 1, 1972
6.498
-0.226
-3.36%
jan 1, 1973
6.631
+0.134
2.06%
jan 1, 1974
6.938
+0.307
4.62%
jan 1, 1975
9.99
+3.052
43.99%
jan 1, 1976
8.759
-1.232
-12.33%
jan 1, 1977
7.322
-1.437
-16.41%
jan 1, 1978
8.138
+0.816
11.14%
jan 1, 1979
6.457
-1.681
-20.66%
jan 1, 1980
6.016
-0.44
-6.82%
jan 1, 1981
6.078
+0.061
1.02%
jan 1, 1982
6.55
+0.472
7.76%
jan 1, 1983
6.378
-0.171
-2.62%
jan 1, 1984
6.092
-0.286
-4.48%
jan 1, 1985
6.374
+0.282
4.63%
jan 1, 1986
5.918
-0.457
-7.16%
jan 1, 1987
5.042
-0.876
-14.8%
jan 1, 1988
4.675
-0.367
-7.27%
jan 1, 1989
5.078
+0.402
8.61%
jan 1, 1990
5.756
+0.679
13.37%
jan 1, 1991
5.276
-0.481
-8.35%
jan 1, 1992
5.489
+0.213
4.04%
jan 1, 1993
5.316
-0.172
-3.14%
jan 1, 1994
6.698
+1.381
25.98%
jan 1, 1995
7.111
+0.413
6.17%
jan 1, 1996
6.555
-0.556
-7.82%
jan 1, 1997
6.968
+0.413
6.31%
jan 1, 1998
6.944
-0.024
-0.35%
jan 1, 1999
6.659
-0.286
-4.11%
jan 1, 2000
6.704
+0.045
0.68%
jan 1, 2001
6.903
+0.199
2.97%
jan 1, 2002
7.38
+0.477
6.91%
jan 1, 2003
6.952
-0.428
-5.8%
jan 1, 2004
8.279
+1.327
19.09%
jan 1, 2005
9.302
+1.024
12.36%
jan 1, 2006
9.557
+0.255
2.74%
jan 1, 2007
9.681
+0.124
1.3%
jan 1, 2008
10.358
+0.677
6.99%
jan 1, 2009
10.775
+0.417
4.02%
jan 1, 2010
11.499
+0.725
6.73%
jan 1, 2011
13.15
+1.651
14.35%
jan 1, 2012
12.715
-0.435
-3.31%
jan 1, 2013
12.986
+0.271
2.13%
jan 1, 2014
12.86
-0.126
-0.97%
jan 1, 2015
12.853
-0.006
-0.05%
Ranking of countries by current statistics by years


Comments: