29
/
en
AIzaSyAYiBZKx7MnpbEhh9jyipgxe19OcubqV5w
April 1, 2024
74174
Austria
AUT
true
2
1
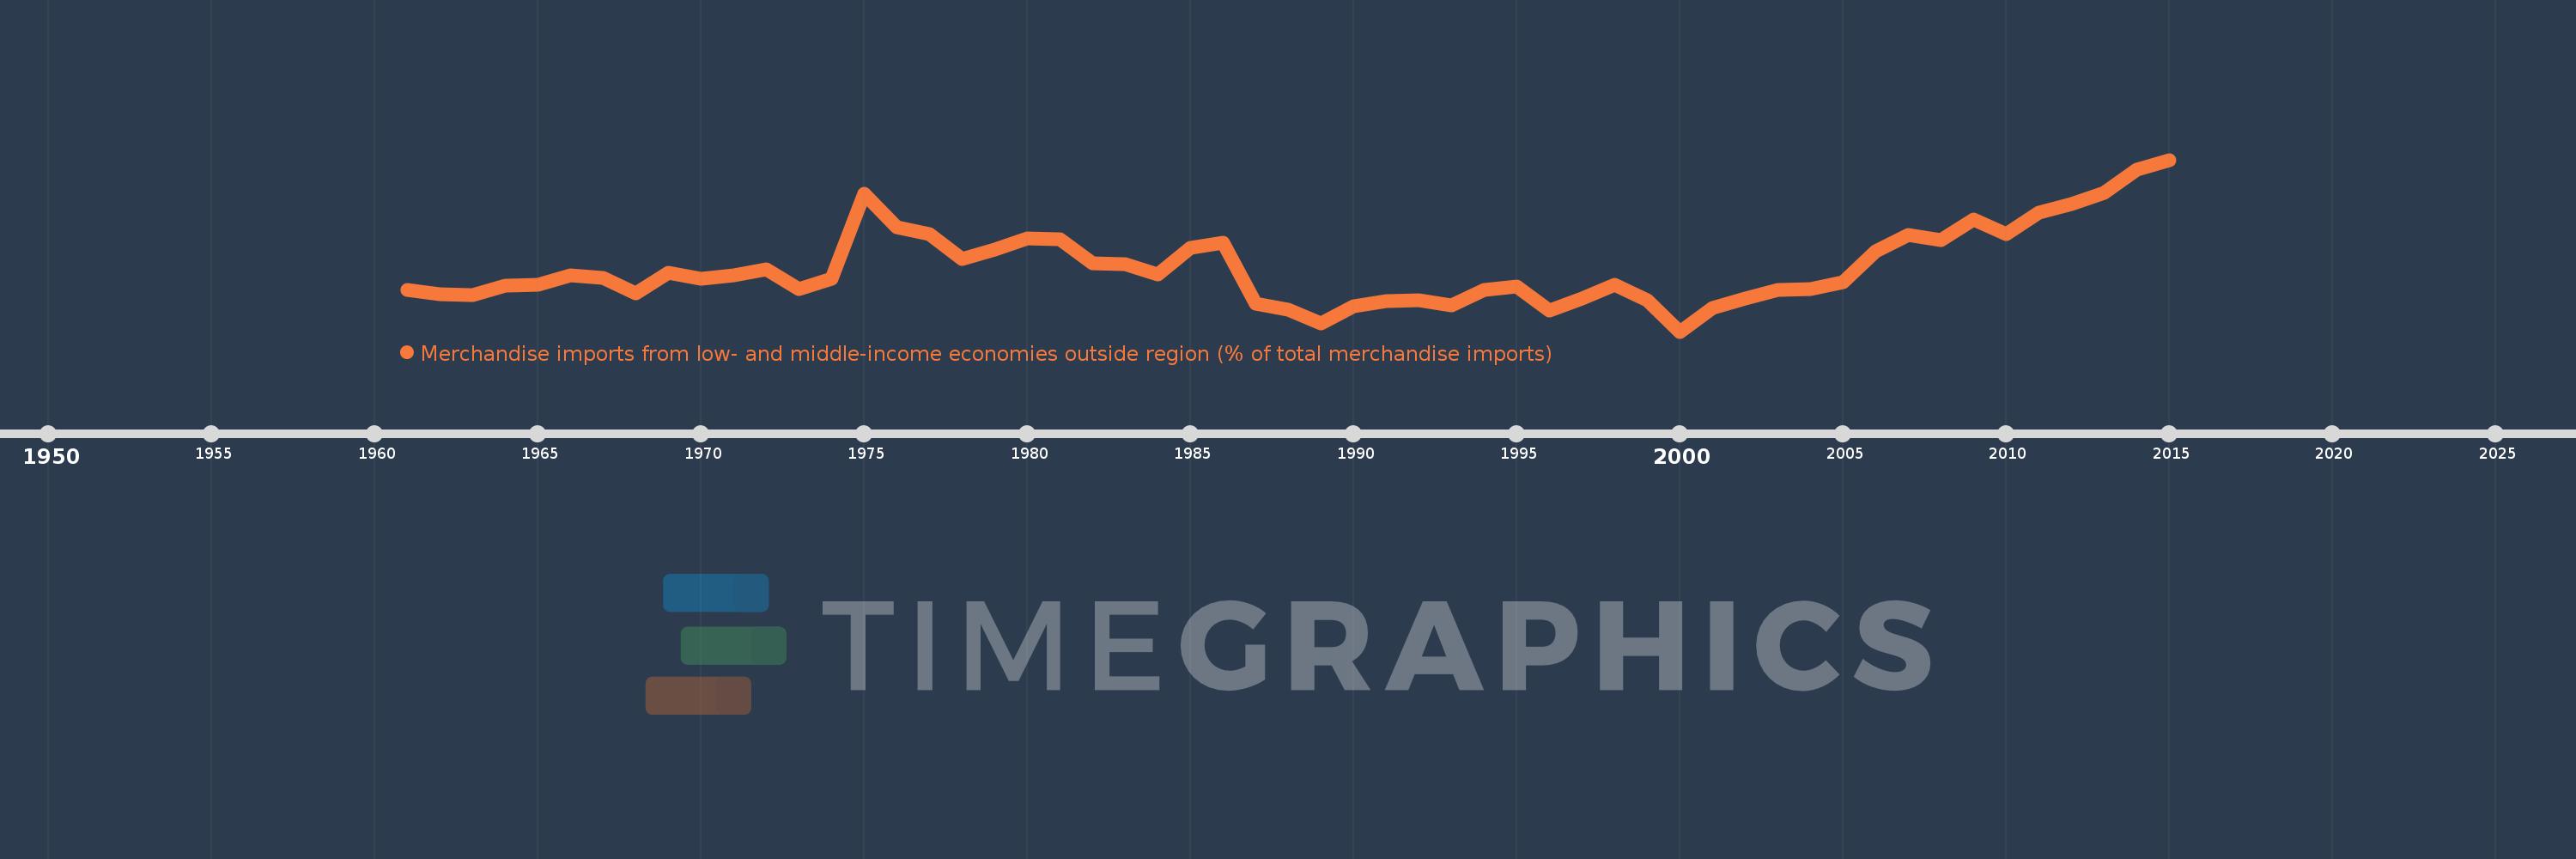
Merchandise imports from low- and middle-income economies outside region (% of total merchandise imports)
2015,2014,2013,2012,2011,2010,2009,2008,2007,2006,2005,2004,2003,2002,2001,2000,1999,1998,1997,1996,1995,1994,1993,1992,1991,1990,1989,1988,1987,1986,1985,1984,1983,1982,1981,1980,1979,1978,1977,1976,1975,1974,1973,1972,1971,1970,1969,1968,1967,1966,1965,1964,1963,1962,1961
This statistics in other country:
AfghanistanAlbaniaAlgeriaAngolaArab WorldArgentinaArmeniaArubaAustraliaAustriaAzerbaijanBahamas, TheBahrainBangladeshBarbadosBelarusBelgiumBelizeBeninBermudaBoliviaBrazilBrunei DarussalamBulgariaBurkina FasoBurundiCabo VerdeCambodiaCameroonCanadaCaribbean small statesCentral African RepublicCentral Europe and the BalticsChileChinaColombiaCongo, Dem. Rep.Congo, Rep.Costa RicaCote d'IvoireCroatiaCubaCyprusCzech RepublicDenmarkDominicaDominican RepublicEarly-demographic dividendEast Asia & PacificEast Asia & Pacific (excluding high income)East Asia & Pacific (IDA & IBRD countries)EcuadorEgypt, Arab Rep.El SalvadorEstoniaEthiopiaEuro areaEurope & Central AsiaEurope & Central Asia (excluding high income)Europe & Central Asia (IDA & IBRD countries)European UnionFijiFinlandFragile and conflict affected situationsFranceGabonGambia, TheGeorgiaGermanyGhanaGreeceGreenlandGrenadaGuatemalaGuineaGuyanaHaitiHeavily indebted poor countries (HIPC)High incomeHondurasHong Kong SAR, ChinaHungaryIBRD onlyIcelandIDA & IBRD totalIDA blendIDA onlyIDA totalIndiaIndonesiaIran, Islamic Rep.IraqIrelandIsraelItalyJamaicaJapanJordanKazakhstanKenyaKorea, Dem. People’s Rep.Korea, Rep.KuwaitKyrgyz RepublicLao PDRLate-demographic dividendLatin America & Caribbean Latin America & Caribbean (excluding high income)Latin America & the Caribbean (IDA & IBRD countries)LatviaLeast developed countries: UN classificationLebanonLiberiaLibyaLithuaniaLow & middle incomeLow incomeLower middle incomeLuxembourgMacao SAR, ChinaMacedonia, FYRMadagascarMalawiMalaysiaMaliMaltaMauritaniaMauritiusMexicoMiddle East & North AfricaMiddle East & North Africa (excluding high income)Middle East & North Africa (IDA & IBRD countries)Middle incomeMoldovaMongoliaMontenegroMoroccoMozambiqueMyanmarNetherlandsNew CaledoniaNew ZealandNicaraguaNigerNigeriaNorth AmericaNorwayOECD membersOmanOther small statesPacific island small statesPakistanPanamaPapua New GuineaParaguayPeruPhilippinesPolandPortugalPost-demographic dividendPre-demographic dividendQatarRomaniaRussian FederationRwandaSaudi ArabiaSenegalSerbiaSeychellesSierra LeoneSingaporeSlovak RepublicSloveniaSmall statesSomaliaSouth AfricaSouth AsiaSouth Asia (IDA & IBRD)SpainSri LankaSt. Kitts and NevisSt. LuciaSt. Vincent and the GrenadinesSub-Saharan Africa Sub-Saharan Africa (excluding high income)Sub-Saharan Africa (IDA & IBRD countries)SudanSurinameSwedenSwitzerlandSyrian Arab RepublicTanzaniaThailandTogoTrinidad and TobagoTunisiaTurkeyUgandaUkraineUnited Arab EmiratesUnited KingdomUnited StatesUpper middle incomeUruguayVenezuela, RBVietnamWorldYemen, Rep.ZambiaZimbabwe Timeline:
This timeline shows a graph from 1961 to 2015 of Austria. No data until 1960. Number of actual observations by date: 55.
Source name:
World Development Indicators
Source organization:
World Bank staff estimates based data from International Monetary Fund's Direction of Trade database.
Categories, topics:
Private Sector, Trade
Last updated:
apr 23, 2017
Indicators value changes by year
Maximum:
12.342
jan 1, 2015
At the date of observation
Value
Absolute change
Change from previous value
jan 1, 1961
6.679
+6.679
0.0%
jan 1, 1962
6.52
-0.159
-2.39%
jan 1, 1963
6.468
-0.052
-0.8%
jan 1, 1964
6.875
+0.407
6.29%
jan 1, 1965
6.925
+0.05
0.72%
jan 1, 1966
7.32
+0.395
5.71%
jan 1, 1967
7.204
-0.116
-1.58%
jan 1, 1968
6.526
-0.679
-9.42%
jan 1, 1969
7.432
+0.907
13.9%
jan 1, 1970
7.178
-0.254
-3.42%
jan 1, 1971
7.331
+0.153
2.13%
jan 1, 1972
7.59
+0.259
3.53%
jan 1, 1973
6.734
-0.856
-11.28%
jan 1, 1974
7.17
+0.436
6.48%
jan 1, 1975
10.886
+3.716
51.82%
jan 1, 1976
9.398
-1.488
-13.67%
jan 1, 1977
9.106
-0.292
-3.11%
jan 1, 1978
8.033
-1.073
-11.79%
jan 1, 1979
8.44
+0.407
5.07%
jan 1, 1980
8.941
+0.501
5.94%
jan 1, 1981
8.896
-0.045
-0.51%
jan 1, 1982
7.86
-1.036
-11.64%
jan 1, 1983
7.794
-0.066
-0.84%
jan 1, 1984
7.383
-0.41
-5.27%
jan 1, 1985
8.525
+1.142
15.47%
jan 1, 1986
8.744
+0.219
2.57%
jan 1, 1987
6.089
-2.655
-30.37%
jan 1, 1988
5.828
-0.261
-4.29%
jan 1, 1989
5.248
-0.579
-9.94%
jan 1, 1990
5.978
+0.729
13.9%
jan 1, 1991
6.224
+0.246
4.11%
jan 1, 1992
6.248
+0.024
0.38%
jan 1, 1993
6.038
-0.209
-3.35%
jan 1, 1994
6.707
+0.668
11.07%
jan 1, 1995
6.855
+0.149
2.22%
jan 1, 1996
5.784
-1.071
-15.63%
jan 1, 1997
6.32
+0.536
9.27%
jan 1, 1998
6.92
+0.601
9.51%
jan 1, 1999
6.247
-0.674
-9.73%
jan 1, 2000
4.885
-1.362
-21.8%
jan 1, 2001
5.924
+1.039
21.27%
jan 1, 2002
6.319
+0.395
6.67%
jan 1, 2003
6.707
+0.388
6.14%
jan 1, 2004
6.743
+0.036
0.53%
jan 1, 2005
7.022
+0.279
4.14%
jan 1, 2006
8.376
+1.354
19.29%
jan 1, 2007
9.087
+0.711
8.49%
jan 1, 2008
8.852
-0.235
-2.58%
jan 1, 2009
9.743
+0.89
10.06%
jan 1, 2010
9.101
-0.642
-6.59%
jan 1, 2011
10.064
+0.963
10.58%
jan 1, 2012
10.413
+0.349
3.47%
jan 1, 2013
10.919
+0.506
4.86%
jan 1, 2014
11.918
+0.999
9.15%
jan 1, 2015
12.342
+0.424
3.55%
Ranking of countries by current statistics by years


Comments: