29
/
en
AIzaSyAYiBZKx7MnpbEhh9jyipgxe19OcubqV5w
April 1, 2024
35166
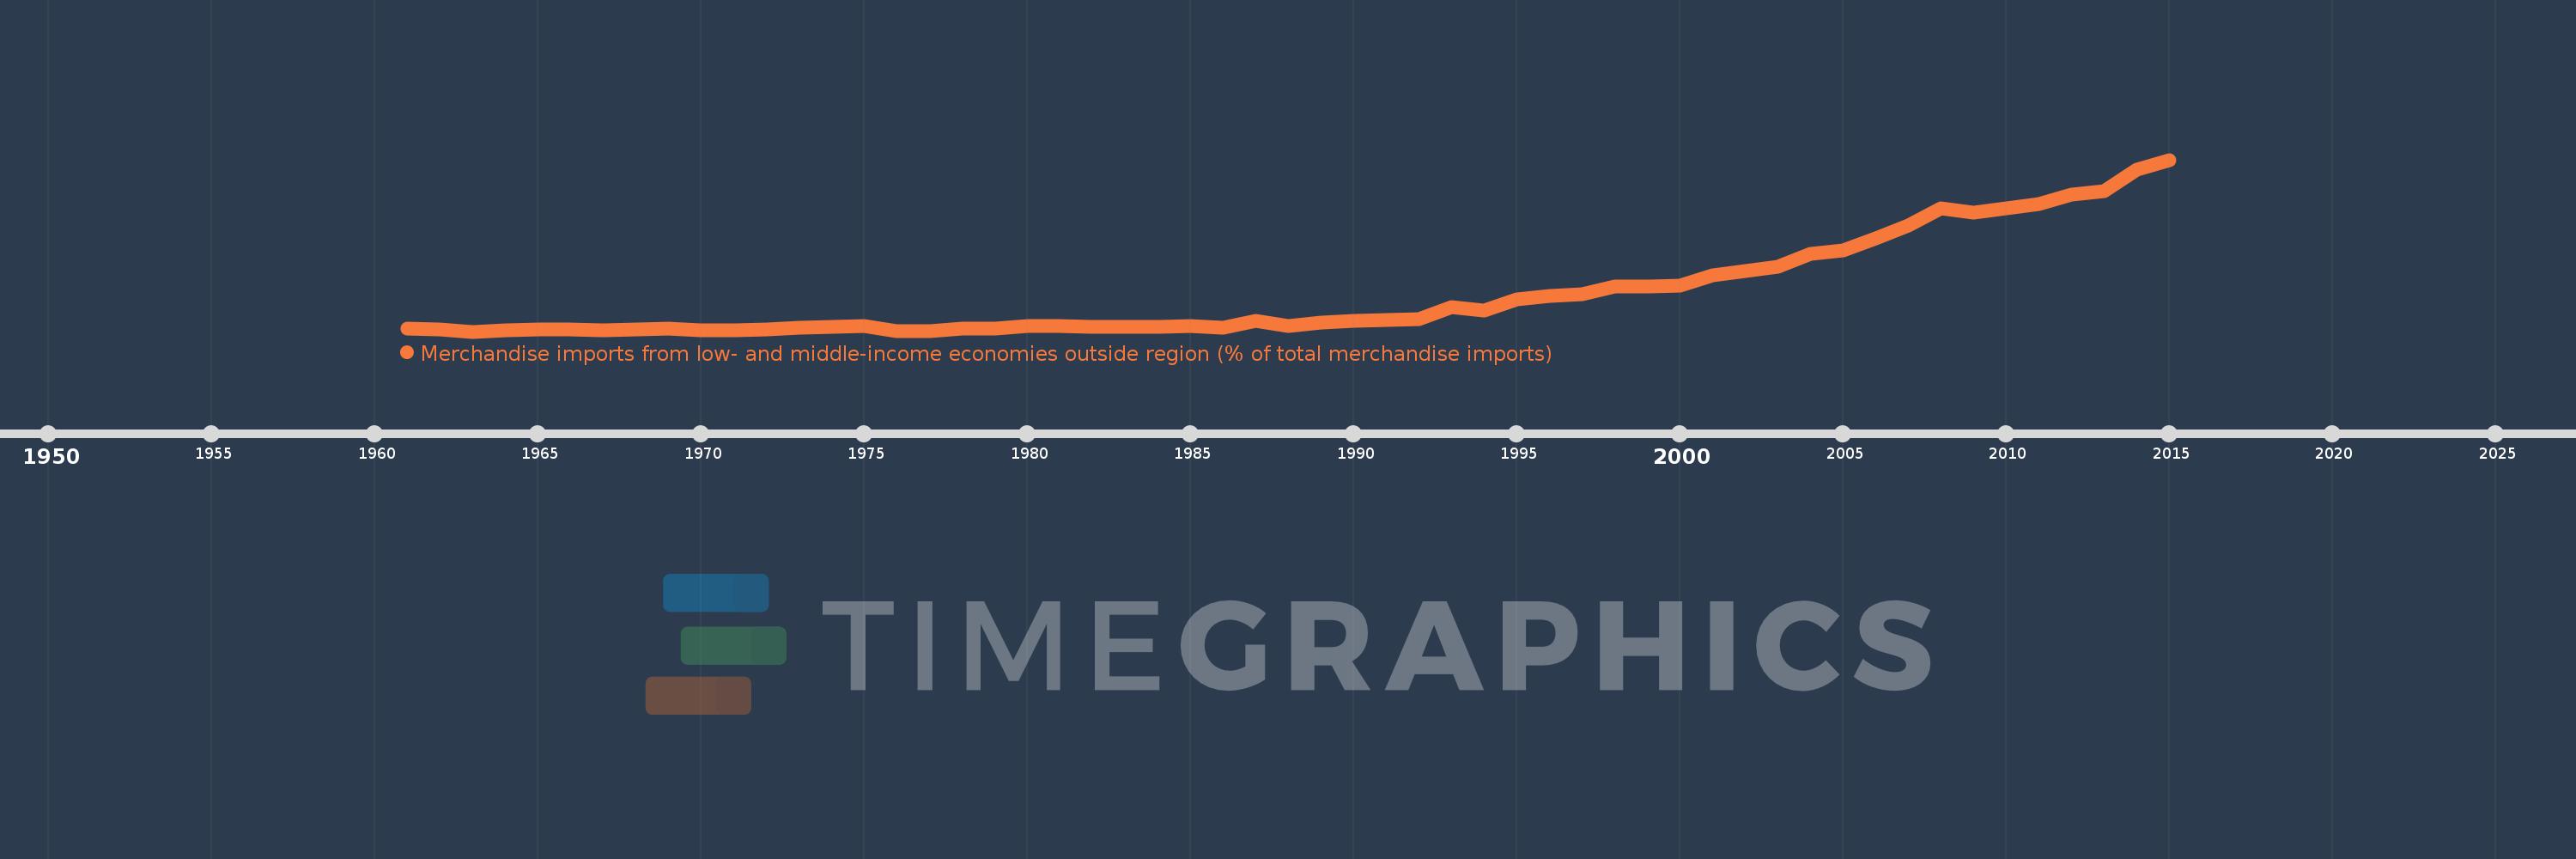
Heavily indebted poor countries (HIPC)
HPC
false
2
1
Merchandise imports from low- and middle-income economies outside region (% of total merchandise imports)
2015,2014,2013,2012,2011,2010,2009,2008,2007,2006,2005,2004,2003,2002,2001,2000,1999,1998,1997,1996,1995,1994,1993,1992,1991,1990,1989,1988,1987,1986,1985,1984,1983,1982,1981,1980,1979,1978,1977,1976,1975,1974,1973,1972,1971,1970,1969,1968,1967,1966,1965,1964,1963,1962,1961
This statistics in other country:
AfghanistanAlbaniaAlgeriaAngolaArab WorldArgentinaArmeniaArubaAustraliaAustriaAzerbaijanBahamas, TheBahrainBangladeshBarbadosBelarusBelgiumBelizeBeninBermudaBoliviaBrazilBrunei DarussalamBulgariaBurkina FasoBurundiCabo VerdeCambodiaCameroonCanadaCaribbean small statesCentral African RepublicCentral Europe and the BalticsChileChinaColombiaCongo, Dem. Rep.Congo, Rep.Costa RicaCote d'IvoireCroatiaCubaCyprusCzech RepublicDenmarkDominicaDominican RepublicEarly-demographic dividendEast Asia & PacificEast Asia & Pacific (excluding high income)East Asia & Pacific (IDA & IBRD countries)EcuadorEgypt, Arab Rep.El SalvadorEstoniaEthiopiaEuro areaEurope & Central AsiaEurope & Central Asia (excluding high income)Europe & Central Asia (IDA & IBRD countries)European UnionFijiFinlandFragile and conflict affected situationsFranceGabonGambia, TheGeorgiaGermanyGhanaGreeceGreenlandGrenadaGuatemalaGuineaGuyanaHaitiHeavily indebted poor countries (HIPC)High incomeHondurasHong Kong SAR, ChinaHungaryIBRD onlyIcelandIDA & IBRD totalIDA blendIDA onlyIDA totalIndiaIndonesiaIran, Islamic Rep.IraqIrelandIsraelItalyJamaicaJapanJordanKazakhstanKenyaKorea, Dem. People’s Rep.Korea, Rep.KuwaitKyrgyz RepublicLao PDRLate-demographic dividendLatin America & Caribbean Latin America & Caribbean (excluding high income)Latin America & the Caribbean (IDA & IBRD countries)LatviaLeast developed countries: UN classificationLebanonLiberiaLibyaLithuaniaLow & middle incomeLow incomeLower middle incomeLuxembourgMacao SAR, ChinaMacedonia, FYRMadagascarMalawiMalaysiaMaliMaltaMauritaniaMauritiusMexicoMiddle East & North AfricaMiddle East & North Africa (excluding high income)Middle East & North Africa (IDA & IBRD countries)Middle incomeMoldovaMongoliaMontenegroMoroccoMozambiqueMyanmarNetherlandsNew CaledoniaNew ZealandNicaraguaNigerNigeriaNorth AmericaNorwayOECD membersOmanOther small statesPacific island small statesPakistanPanamaPapua New GuineaParaguayPeruPhilippinesPolandPortugalPost-demographic dividendPre-demographic dividendQatarRomaniaRussian FederationRwandaSaudi ArabiaSenegalSerbiaSeychellesSierra LeoneSingaporeSlovak RepublicSloveniaSmall statesSomaliaSouth AfricaSouth AsiaSouth Asia (IDA & IBRD)SpainSri LankaSt. Kitts and NevisSt. LuciaSt. Vincent and the GrenadinesSub-Saharan Africa Sub-Saharan Africa (excluding high income)Sub-Saharan Africa (IDA & IBRD countries)SudanSurinameSwedenSwitzerlandSyrian Arab RepublicTanzaniaThailandTogoTrinidad and TobagoTunisiaTurkeyUgandaUkraineUnited Arab EmiratesUnited KingdomUnited StatesUpper middle incomeUruguayVenezuela, RBVietnamWorldYemen, Rep.ZambiaZimbabwe Timeline:
This timeline shows a graph from 1961 to 2015 of Heavily indebted poor countries (HIPC). No data until 1960. Number of actual observations by date: 55.
Source name:
World Development Indicators
Source organization:
World Bank staff estimates based data from International Monetary Fund's Direction of Trade database.
Categories, topics:
Private Sector, Trade
Last updated:
apr 23, 2017
Indicators value changes by year
Maximum:
34.676
jan 1, 2015
At the date of observation
Value
Absolute change
Change from previous value
jan 1, 1961
1.259
+1.259
0.0%
jan 1, 1962
1.12
-0.14
-11.1%
jan 1, 1963
0.639
-0.481
-42.96%
jan 1, 1964
0.916
+0.278
43.48%
jan 1, 1965
1.041
+0.124
13.58%
jan 1, 1966
1.059
+0.018
1.77%
jan 1, 1967
0.91
-0.15
-14.12%
jan 1, 1968
1.029
+0.12
13.17%
jan 1, 1969
1.304
+0.275
26.68%
jan 1, 1970
0.94
-0.364
-27.95%
jan 1, 1971
0.817
-0.122
-13.0%
jan 1, 1972
1.096
+0.279
34.1%
jan 1, 1973
1.392
+0.296
26.97%
jan 1, 1974
1.605
+0.213
15.3%
jan 1, 1975
1.779
+0.174
10.86%
jan 1, 1976
0.719
-1.06
-59.61%
jan 1, 1977
0.797
+0.078
10.89%
jan 1, 1978
1.154
+0.357
44.81%
jan 1, 1979
1.3
+0.146
12.64%
jan 1, 1980
1.724
+0.424
32.62%
jan 1, 1981
1.73
+0.006
0.36%
jan 1, 1982
1.632
-0.098
-5.65%
jan 1, 1983
1.612
-0.02
-1.23%
jan 1, 1984
1.549
-0.063
-3.92%
jan 1, 1985
1.784
+0.235
15.17%
jan 1, 1986
1.347
-0.437
-24.49%
jan 1, 1987
2.834
+1.487
110.37%
jan 1, 1988
1.68
-1.154
-40.72%
jan 1, 1989
2.494
+0.815
48.49%
jan 1, 1990
2.691
+0.197
7.89%
jan 1, 1991
2.969
+0.278
10.32%
jan 1, 1992
3.034
+0.065
2.19%
jan 1, 1993
5.427
+2.393
78.89%
jan 1, 1994
4.819
-0.608
-11.2%
jan 1, 1995
7.019
+2.2
45.66%
jan 1, 1996
7.748
+0.729
10.38%
jan 1, 1997
7.959
+0.212
2.73%
jan 1, 1998
9.613
+1.653
20.77%
jan 1, 1999
9.5
-0.112
-1.17%
jan 1, 2000
9.705
+0.205
2.16%
jan 1, 2001
11.702
+1.996
20.57%
jan 1, 2002
12.691
+0.989
8.45%
jan 1, 2003
13.493
+0.801
6.32%
jan 1, 2004
15.994
+2.501
18.54%
jan 1, 2005
16.783
+0.789
4.93%
jan 1, 2006
19.049
+2.266
13.5%
jan 1, 2007
21.598
+2.549
13.38%
jan 1, 2008
25.085
+3.487
16.15%
jan 1, 2009
24.284
-0.801
-3.19%
jan 1, 2010
24.976
+0.693
2.85%
jan 1, 2011
25.831
+0.855
3.42%
jan 1, 2012
27.725
+1.893
7.33%
jan 1, 2013
28.506
+0.781
2.82%
jan 1, 2014
32.727
+4.221
14.81%
jan 1, 2015
34.676
+1.949
5.96%
Ranking of countries by current statistics by years


Comments: