29
/
en
AIzaSyAYiBZKx7MnpbEhh9jyipgxe19OcubqV5w
April 1, 2024
42632
Latin America & Caribbean (excluding high income)
LAC
false
2
1
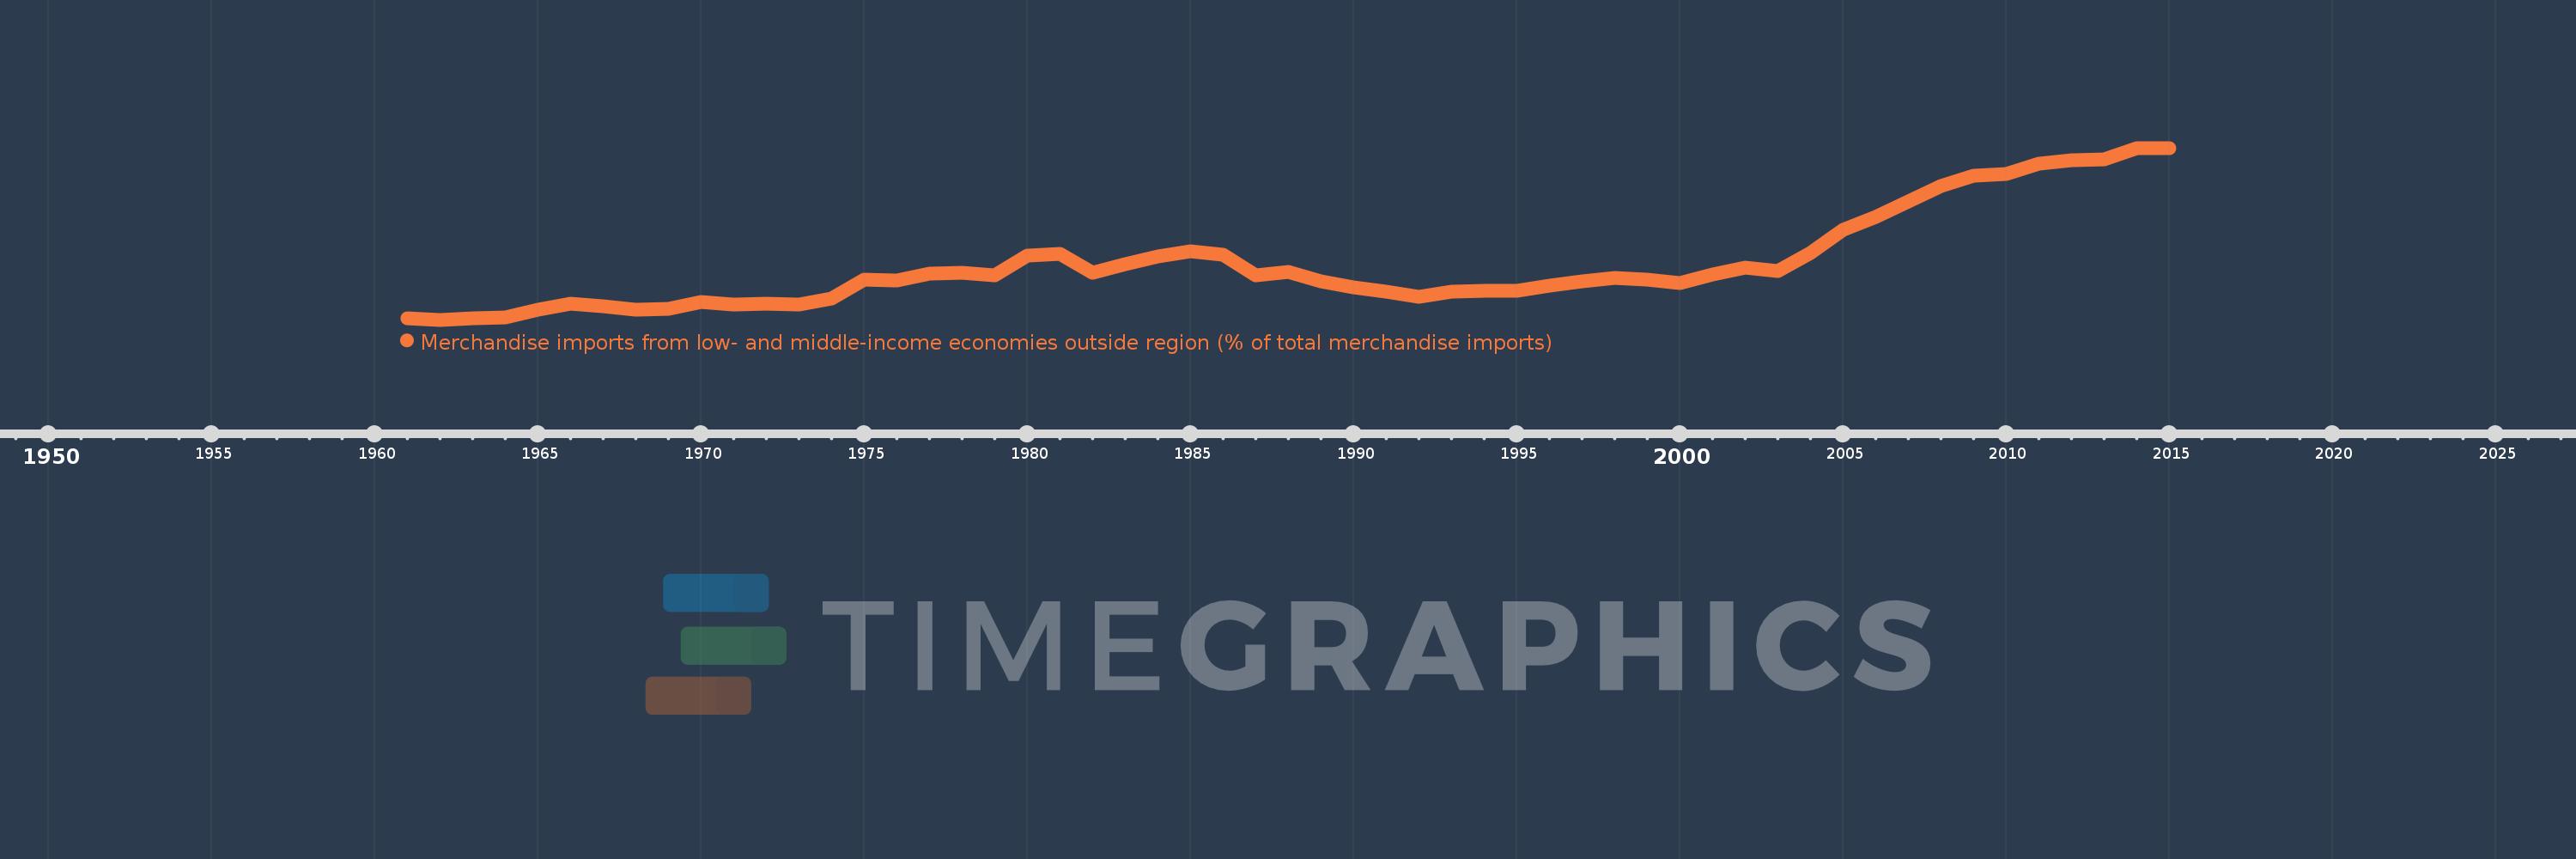
Merchandise imports from low- and middle-income economies outside region (% of total merchandise imports)
2015,2014,2013,2012,2011,2010,2009,2008,2007,2006,2005,2004,2003,2002,2001,2000,1999,1998,1997,1996,1995,1994,1993,1992,1991,1990,1989,1988,1987,1986,1985,1984,1983,1982,1981,1980,1979,1978,1977,1976,1975,1974,1973,1972,1971,1970,1969,1968,1967,1966,1965,1964,1963,1962,1961
This statistics in other country:
AfghanistanAlbaniaAlgeriaAngolaArab WorldArgentinaArmeniaArubaAustraliaAustriaAzerbaijanBahamas, TheBahrainBangladeshBarbadosBelarusBelgiumBelizeBeninBermudaBoliviaBrazilBrunei DarussalamBulgariaBurkina FasoBurundiCabo VerdeCambodiaCameroonCanadaCaribbean small statesCentral African RepublicCentral Europe and the BalticsChileChinaColombiaCongo, Dem. Rep.Congo, Rep.Costa RicaCote d'IvoireCroatiaCubaCyprusCzech RepublicDenmarkDominicaDominican RepublicEarly-demographic dividendEast Asia & PacificEast Asia & Pacific (excluding high income)East Asia & Pacific (IDA & IBRD countries)EcuadorEgypt, Arab Rep.El SalvadorEstoniaEthiopiaEuro areaEurope & Central AsiaEurope & Central Asia (excluding high income)Europe & Central Asia (IDA & IBRD countries)European UnionFijiFinlandFragile and conflict affected situationsFranceGabonGambia, TheGeorgiaGermanyGhanaGreeceGreenlandGrenadaGuatemalaGuineaGuyanaHaitiHeavily indebted poor countries (HIPC)High incomeHondurasHong Kong SAR, ChinaHungaryIBRD onlyIcelandIDA & IBRD totalIDA blendIDA onlyIDA totalIndiaIndonesiaIran, Islamic Rep.IraqIrelandIsraelItalyJamaicaJapanJordanKazakhstanKenyaKorea, Dem. People’s Rep.Korea, Rep.KuwaitKyrgyz RepublicLao PDRLate-demographic dividendLatin America & Caribbean Latin America & Caribbean (excluding high income)Latin America & the Caribbean (IDA & IBRD countries)LatviaLeast developed countries: UN classificationLebanonLiberiaLibyaLithuaniaLow & middle incomeLow incomeLower middle incomeLuxembourgMacao SAR, ChinaMacedonia, FYRMadagascarMalawiMalaysiaMaliMaltaMauritaniaMauritiusMexicoMiddle East & North AfricaMiddle East & North Africa (excluding high income)Middle East & North Africa (IDA & IBRD countries)Middle incomeMoldovaMongoliaMontenegroMoroccoMozambiqueMyanmarNetherlandsNew CaledoniaNew ZealandNicaraguaNigerNigeriaNorth AmericaNorwayOECD membersOmanOther small statesPacific island small statesPakistanPanamaPapua New GuineaParaguayPeruPhilippinesPolandPortugalPost-demographic dividendPre-demographic dividendQatarRomaniaRussian FederationRwandaSaudi ArabiaSenegalSerbiaSeychellesSierra LeoneSingaporeSlovak RepublicSloveniaSmall statesSomaliaSouth AfricaSouth AsiaSouth Asia (IDA & IBRD)SpainSri LankaSt. Kitts and NevisSt. LuciaSt. Vincent and the GrenadinesSub-Saharan Africa Sub-Saharan Africa (excluding high income)Sub-Saharan Africa (IDA & IBRD countries)SudanSurinameSwedenSwitzerlandSyrian Arab RepublicTanzaniaThailandTogoTrinidad and TobagoTunisiaTurkeyUgandaUkraineUnited Arab EmiratesUnited KingdomUnited StatesUpper middle incomeUruguayVenezuela, RBVietnamWorldYemen, Rep.ZambiaZimbabwe Timeline:
This timeline shows a graph from 1961 to 2015 of Latin America & Caribbean (excluding high income). No data until 1960. Number of actual observations by date: 55.
Source name:
World Development Indicators
Source organization:
World Bank staff estimates based data from International Monetary Fund's Direction of Trade database.
Categories, topics:
Private Sector, Trade
Last updated:
apr 23, 2017
Indicators value changes by year
Maximum:
25.968
jan 1, 2015
At the date of observation
Value
Absolute change
Change from previous value
jan 1, 1961
2.475
+2.475
0.0%
jan 1, 1962
2.26
-0.215
-8.7%
jan 1, 1963
2.443
+0.184
8.13%
jan 1, 1964
2.602
+0.159
6.49%
jan 1, 1965
3.589
+0.987
37.92%
jan 1, 1966
4.501
+0.912
25.43%
jan 1, 1967
4.171
-0.33
-7.32%
jan 1, 1968
3.621
-0.55
-13.19%
jan 1, 1969
3.765
+0.144
3.97%
jan 1, 1970
4.679
+0.914
24.27%
jan 1, 1971
4.37
-0.309
-6.6%
jan 1, 1972
4.422
+0.052
1.19%
jan 1, 1973
4.401
-0.021
-0.48%
jan 1, 1974
5.234
+0.833
18.93%
jan 1, 1975
7.737
+2.503
47.82%
jan 1, 1976
7.676
-0.061
-0.79%
jan 1, 1977
8.634
+0.958
12.48%
jan 1, 1978
8.744
+0.11
1.27%
jan 1, 1979
8.354
-0.39
-4.47%
jan 1, 1980
11.079
+2.725
32.62%
jan 1, 1981
11.313
+0.234
2.11%
jan 1, 1982
8.798
-2.515
-22.23%
jan 1, 1983
9.938
+1.141
12.97%
jan 1, 1984
11.028
+1.09
10.97%
jan 1, 1985
11.652
+0.623
5.65%
jan 1, 1986
11.255
-0.397
-3.4%
jan 1, 1987
8.444
-2.811
-24.98%
jan 1, 1988
8.879
+0.435
5.16%
jan 1, 1989
7.587
-1.292
-14.56%
jan 1, 1990
6.757
-0.83
-10.93%
jan 1, 1991
6.188
-0.569
-8.42%
jan 1, 1992
5.41
-0.778
-12.58%
jan 1, 1993
6.119
+0.709
13.11%
jan 1, 1994
6.216
+0.097
1.58%
jan 1, 1995
6.243
+0.027
0.43%
jan 1, 1996
7.024
+0.781
12.52%
jan 1, 1997
7.586
+0.562
8.01%
jan 1, 1998
8.068
+0.481
6.34%
jan 1, 1999
7.823
-0.245
-3.04%
jan 1, 2000
7.293
-0.53
-6.77%
jan 1, 2001
8.483
+1.19
16.32%
jan 1, 2002
9.469
+0.986
11.62%
jan 1, 2003
9.025
-0.444
-4.69%
jan 1, 2004
11.459
+2.434
26.97%
jan 1, 2005
14.636
+3.177
27.72%
jan 1, 2006
16.501
+1.865
12.74%
jan 1, 2007
18.611
+2.11
12.79%
jan 1, 2008
20.752
+2.141
11.5%
jan 1, 2009
22.098
+1.346
6.49%
jan 1, 2010
22.412
+0.314
1.42%
jan 1, 2011
23.811
+1.399
6.24%
jan 1, 2012
24.241
+0.43
1.81%
jan 1, 2013
24.413
+0.172
0.71%
jan 1, 2014
25.879
+1.466
6.01%
jan 1, 2015
25.968
+0.088
0.34%
Ranking of countries by current statistics by years


Comments: