29
/
en
AIzaSyAYiBZKx7MnpbEhh9jyipgxe19OcubqV5w
April 1, 2024
34398
Fragile and conflict affected situations
FCS
false
2
1
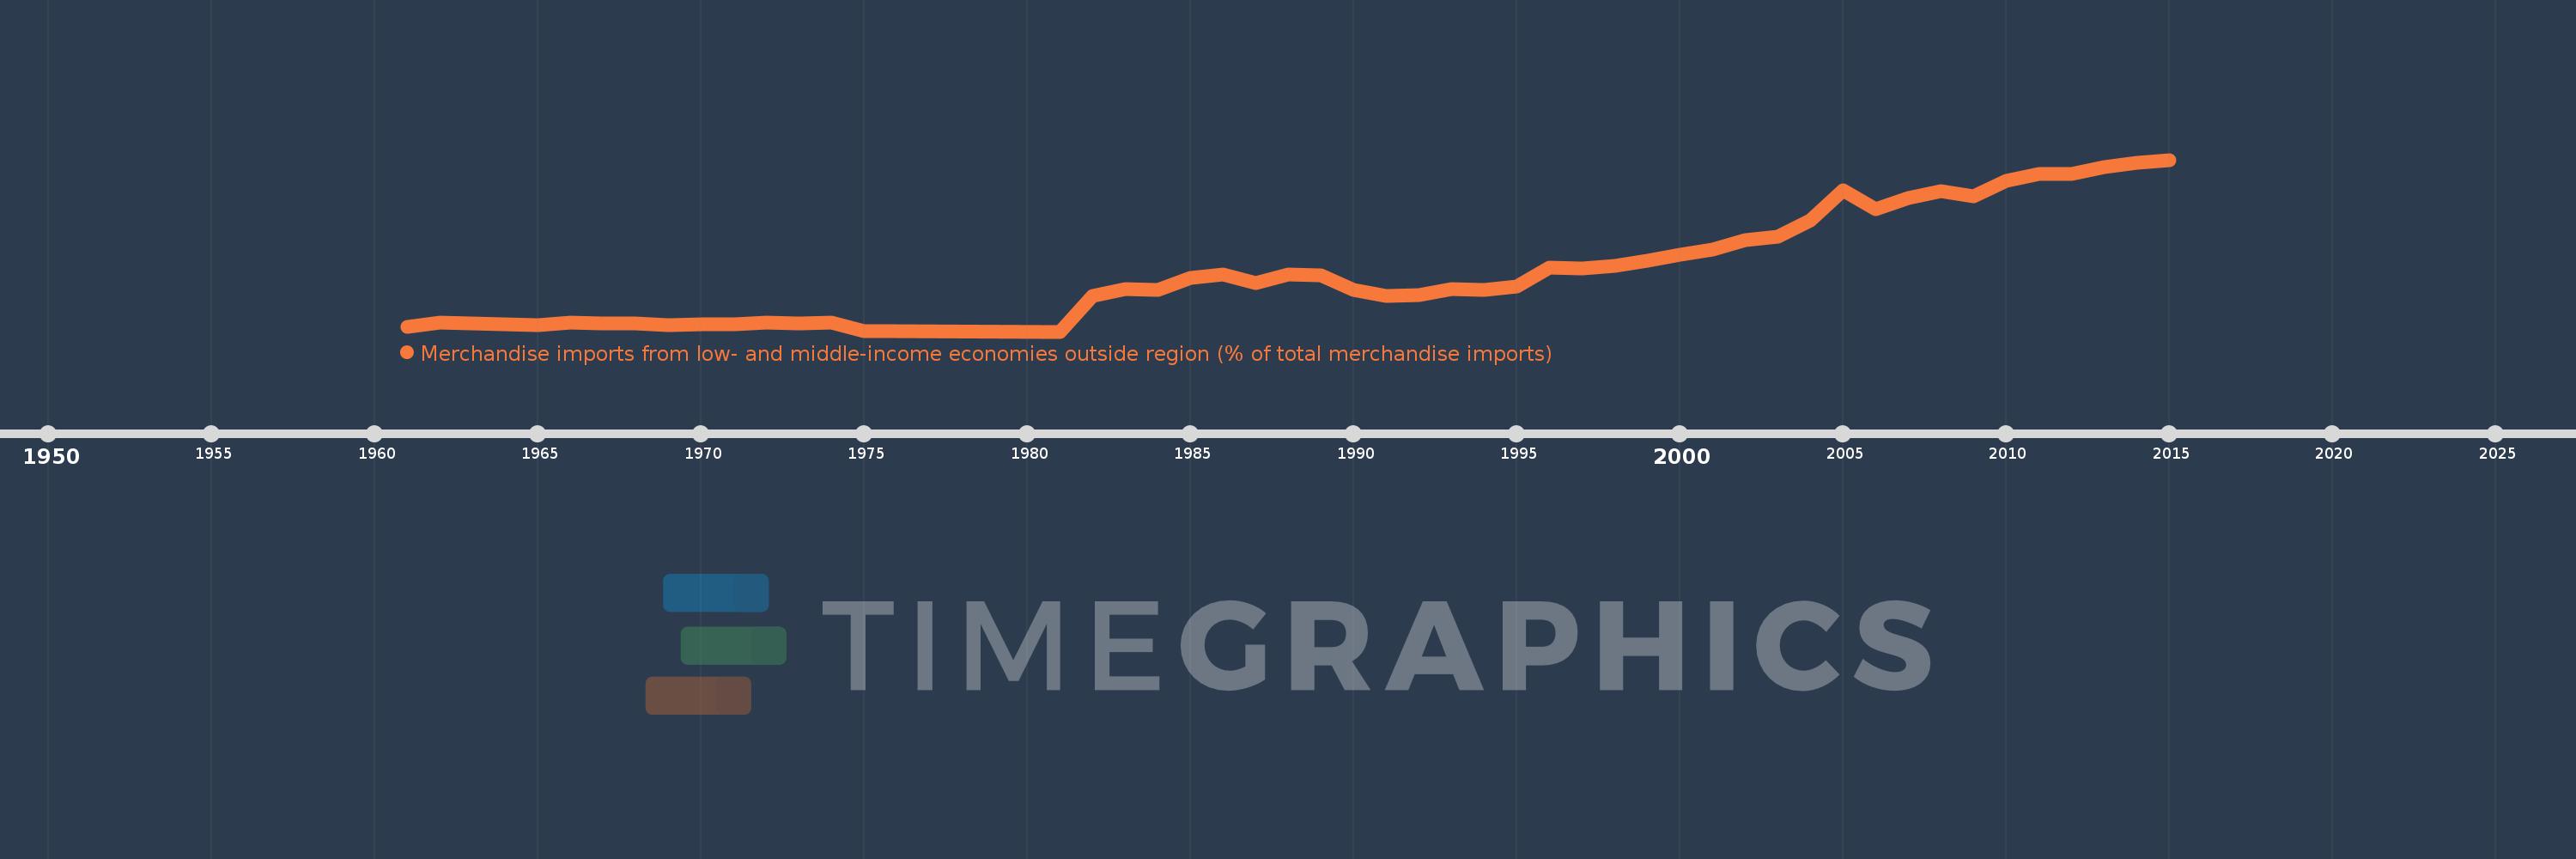
Merchandise imports from low- and middle-income economies outside region (% of total merchandise imports)
2015,2014,2013,2012,2011,2010,2009,2008,2007,2006,2005,2004,2003,2002,2001,2000,1999,1998,1997,1996,1995,1994,1993,1992,1991,1990,1989,1988,1987,1986,1985,1984,1983,1982,1981,1976,1975,1974,1973,1972,1971,1970,1969,1968,1967,1966,1965,1964,1962,1961
This statistics in other country:
AfghanistanAlbaniaAlgeriaAngolaArab WorldArgentinaArmeniaArubaAustraliaAustriaAzerbaijanBahamas, TheBahrainBangladeshBarbadosBelarusBelgiumBelizeBeninBermudaBoliviaBrazilBrunei DarussalamBulgariaBurkina FasoBurundiCabo VerdeCambodiaCameroonCanadaCaribbean small statesCentral African RepublicCentral Europe and the BalticsChileChinaColombiaCongo, Dem. Rep.Congo, Rep.Costa RicaCote d'IvoireCroatiaCubaCyprusCzech RepublicDenmarkDominicaDominican RepublicEarly-demographic dividendEast Asia & PacificEast Asia & Pacific (excluding high income)East Asia & Pacific (IDA & IBRD countries)EcuadorEgypt, Arab Rep.El SalvadorEstoniaEthiopiaEuro areaEurope & Central AsiaEurope & Central Asia (excluding high income)Europe & Central Asia (IDA & IBRD countries)European UnionFijiFinlandFragile and conflict affected situationsFranceGabonGambia, TheGeorgiaGermanyGhanaGreeceGreenlandGrenadaGuatemalaGuineaGuyanaHaitiHeavily indebted poor countries (HIPC)High incomeHondurasHong Kong SAR, ChinaHungaryIBRD onlyIcelandIDA & IBRD totalIDA blendIDA onlyIDA totalIndiaIndonesiaIran, Islamic Rep.IraqIrelandIsraelItalyJamaicaJapanJordanKazakhstanKenyaKorea, Dem. People’s Rep.Korea, Rep.KuwaitKyrgyz RepublicLao PDRLate-demographic dividendLatin America & Caribbean Latin America & Caribbean (excluding high income)Latin America & the Caribbean (IDA & IBRD countries)LatviaLeast developed countries: UN classificationLebanonLiberiaLibyaLithuaniaLow & middle incomeLow incomeLower middle incomeLuxembourgMacao SAR, ChinaMacedonia, FYRMadagascarMalawiMalaysiaMaliMaltaMauritaniaMauritiusMexicoMiddle East & North AfricaMiddle East & North Africa (excluding high income)Middle East & North Africa (IDA & IBRD countries)Middle incomeMoldovaMongoliaMontenegroMoroccoMozambiqueMyanmarNetherlandsNew CaledoniaNew ZealandNicaraguaNigerNigeriaNorth AmericaNorwayOECD membersOmanOther small statesPacific island small statesPakistanPanamaPapua New GuineaParaguayPeruPhilippinesPolandPortugalPost-demographic dividendPre-demographic dividendQatarRomaniaRussian FederationRwandaSaudi ArabiaSenegalSerbiaSeychellesSierra LeoneSingaporeSlovak RepublicSloveniaSmall statesSomaliaSouth AfricaSouth AsiaSouth Asia (IDA & IBRD)SpainSri LankaSt. Kitts and NevisSt. LuciaSt. Vincent and the GrenadinesSub-Saharan Africa Sub-Saharan Africa (excluding high income)Sub-Saharan Africa (IDA & IBRD countries)SudanSurinameSwedenSwitzerlandSyrian Arab RepublicTanzaniaThailandTogoTrinidad and TobagoTunisiaTurkeyUgandaUkraineUnited Arab EmiratesUnited KingdomUnited StatesUpper middle incomeUruguayVenezuela, RBVietnamWorldYemen, Rep.ZambiaZimbabwe Timeline:
This timeline shows a graph from 1961 to 2015 of Fragile and conflict affected situations. No data until 1960. Number of actual observations by date: 50.
Source name:
World Development Indicators
Source organization:
World Bank staff estimates based data from International Monetary Fund's Direction of Trade database.
Categories, topics:
Private Sector, Trade
Last updated:
apr 23, 2017
Indicators value changes by year
Maximum:
29.596
jan 1, 2015
At the date of observation
Value
Absolute change
Change from previous value
jan 1, 1961
0.91
+0.91
0.0%
jan 1, 1962
1.579
+0.669
73.51%
jan 1, 1964
1.336
-0.243
-15.38%
jan 1, 1965
1.153
-0.183
-13.73%
jan 1, 1966
1.626
+0.473
41.02%
jan 1, 1967
1.492
-0.134
-8.25%
jan 1, 1968
1.509
+0.017
1.13%
jan 1, 1969
1.218
-0.29
-19.25%
jan 1, 1970
1.288
+0.07
5.76%
jan 1, 1971
1.313
+0.025
1.91%
jan 1, 1972
1.601
+0.288
21.97%
jan 1, 1973
1.416
-0.186
-11.6%
jan 1, 1974
1.593
+0.177
12.52%
jan 1, 1975
0.078
-1.515
-95.11%
jan 1, 1976
0.061
-0.017
-22.1%
jan 1, 1981
0.042
-0.019
-31.35%
jan 1, 1982
6.168
+6.127
14.7K%
jan 1, 1983
7.415
+1.247
20.21%
jan 1, 1984
7.242
-0.174
-2.34%
jan 1, 1985
9.289
+2.047
28.27%
jan 1, 1986
9.855
+0.566
6.09%
jan 1, 1987
8.333
-1.522
-15.44%
jan 1, 1988
9.864
+1.531
18.37%
jan 1, 1989
9.792
-0.072
-0.73%
jan 1, 1990
7.232
-2.56
-26.15%
jan 1, 1991
6.23
-1.001
-13.85%
jan 1, 1992
6.318
+0.088
1.41%
jan 1, 1993
7.383
+1.065
16.85%
jan 1, 1994
7.209
-0.174
-2.36%
jan 1, 1995
7.835
+0.626
8.68%
jan 1, 1996
11.038
+3.203
40.88%
jan 1, 1997
10.834
-0.204
-1.85%
jan 1, 1998
11.344
+0.511
4.72%
jan 1, 1999
12.238
+0.893
7.88%
jan 1, 2000
13.216
+0.978
7.99%
jan 1, 2001
14.169
+0.953
7.21%
jan 1, 2002
15.793
+1.624
11.46%
jan 1, 2003
16.403
+0.609
3.86%
jan 1, 2004
19.116
+2.713
16.54%
jan 1, 2005
24.303
+5.187
27.13%
jan 1, 2006
21.091
-3.212
-13.22%
jan 1, 2007
22.994
+1.903
9.03%
jan 1, 2008
24.132
+1.138
4.95%
jan 1, 2009
23.354
-0.778
-3.23%
jan 1, 2010
25.98
+2.626
11.25%
jan 1, 2011
27.222
+1.242
4.78%
jan 1, 2012
27.174
-0.048
-0.17%
jan 1, 2013
28.291
+1.117
4.11%
jan 1, 2014
29.104
+0.813
2.87%
jan 1, 2015
29.596
+0.492
1.69%
Ranking of countries by current statistics by years


Comments: