29
/
en
AIzaSyAYiBZKx7MnpbEhh9jyipgxe19OcubqV5w
April 1, 2024
52061
North America
NAC
false
2
1
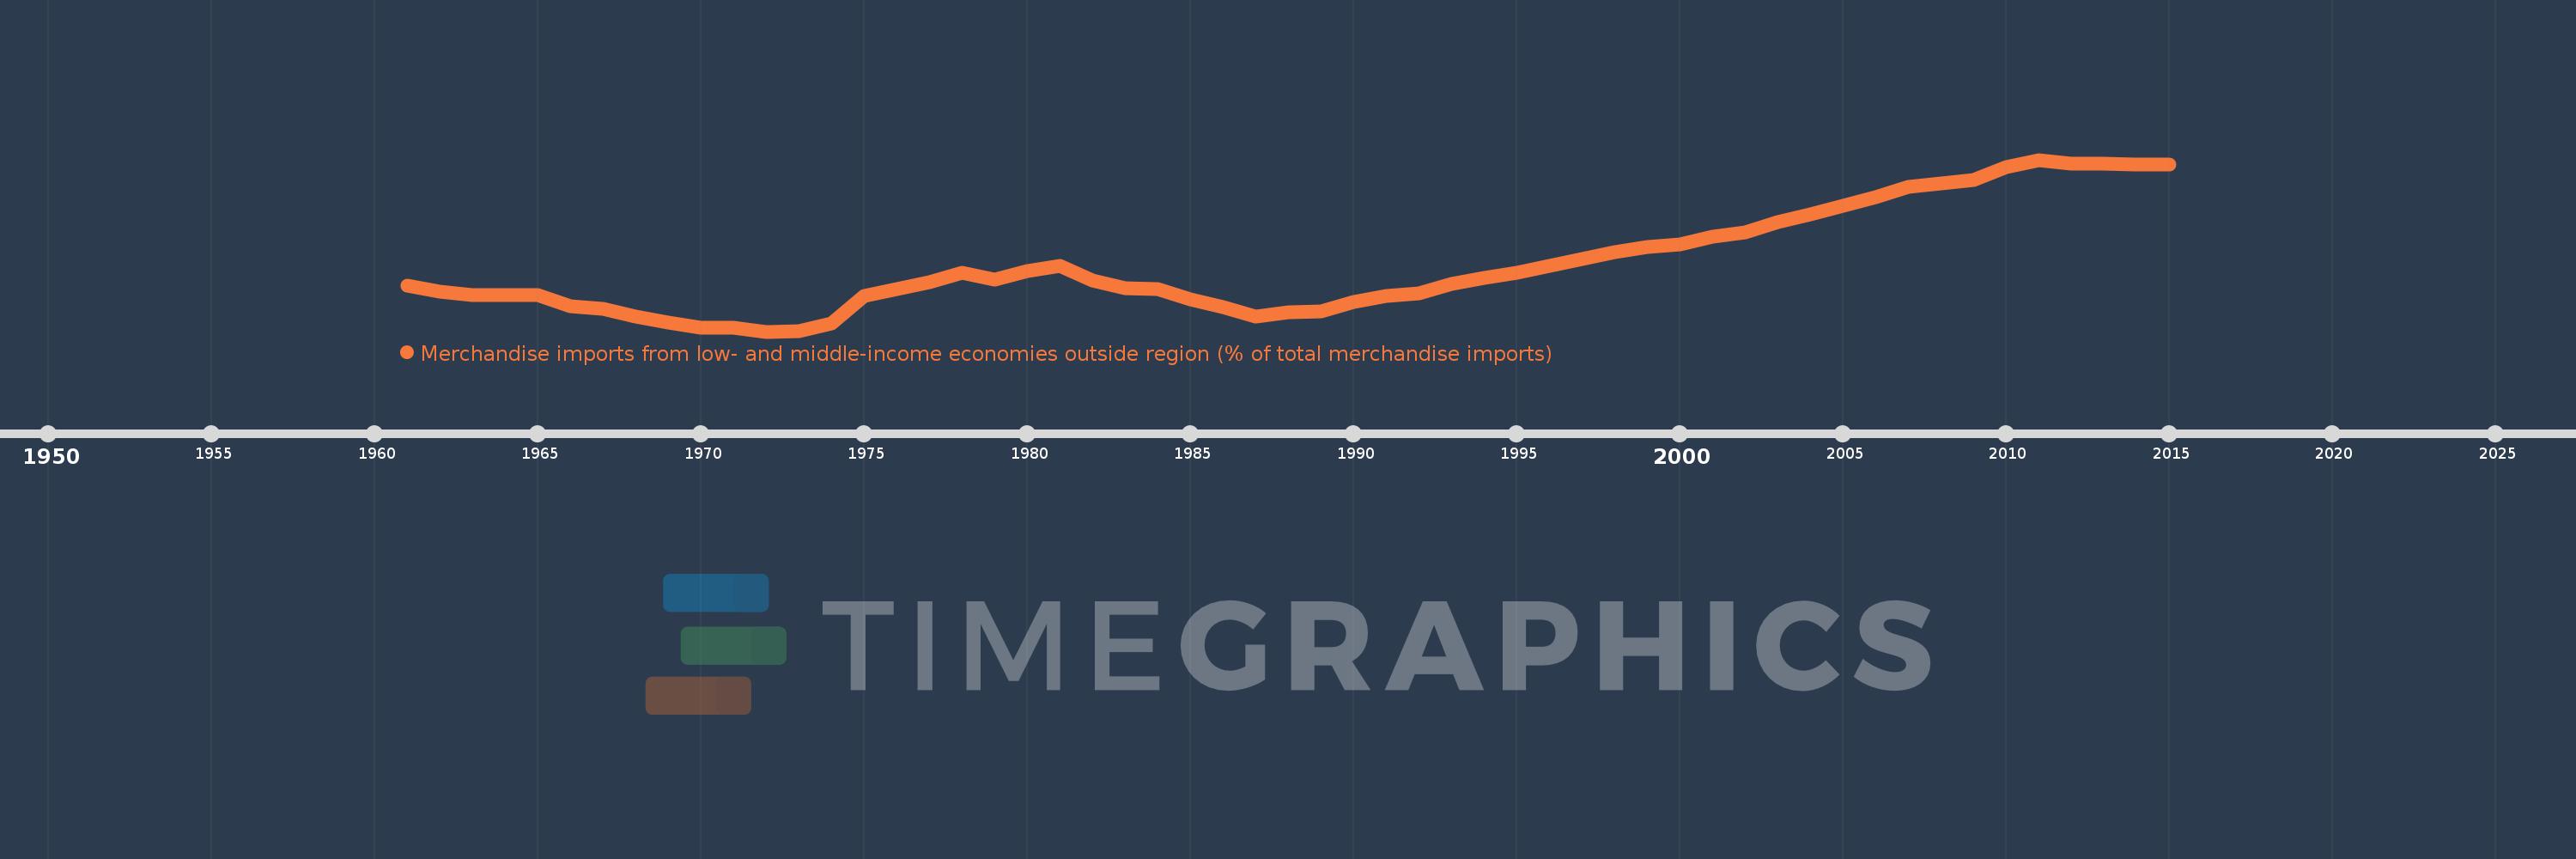
Merchandise imports from low- and middle-income economies outside region (% of total merchandise imports)
2015,2014,2013,2012,2011,2010,2009,2008,2007,2006,2005,2004,2003,2002,2001,2000,1999,1998,1997,1996,1995,1994,1993,1992,1991,1990,1989,1988,1987,1986,1985,1984,1983,1982,1981,1980,1979,1978,1977,1976,1975,1974,1973,1972,1971,1970,1969,1968,1967,1966,1965,1964,1963,1962,1961
This statistics in other country:
AfghanistanAlbaniaAlgeriaAngolaArab WorldArgentinaArmeniaArubaAustraliaAustriaAzerbaijanBahamas, TheBahrainBangladeshBarbadosBelarusBelgiumBelizeBeninBermudaBoliviaBrazilBrunei DarussalamBulgariaBurkina FasoBurundiCabo VerdeCambodiaCameroonCanadaCaribbean small statesCentral African RepublicCentral Europe and the BalticsChileChinaColombiaCongo, Dem. Rep.Congo, Rep.Costa RicaCote d'IvoireCroatiaCubaCyprusCzech RepublicDenmarkDominicaDominican RepublicEarly-demographic dividendEast Asia & PacificEast Asia & Pacific (excluding high income)East Asia & Pacific (IDA & IBRD countries)EcuadorEgypt, Arab Rep.El SalvadorEstoniaEthiopiaEuro areaEurope & Central AsiaEurope & Central Asia (excluding high income)Europe & Central Asia (IDA & IBRD countries)European UnionFijiFinlandFragile and conflict affected situationsFranceGabonGambia, TheGeorgiaGermanyGhanaGreeceGreenlandGrenadaGuatemalaGuineaGuyanaHaitiHeavily indebted poor countries (HIPC)High incomeHondurasHong Kong SAR, ChinaHungaryIBRD onlyIcelandIDA & IBRD totalIDA blendIDA onlyIDA totalIndiaIndonesiaIran, Islamic Rep.IraqIrelandIsraelItalyJamaicaJapanJordanKazakhstanKenyaKorea, Dem. People’s Rep.Korea, Rep.KuwaitKyrgyz RepublicLao PDRLate-demographic dividendLatin America & Caribbean Latin America & Caribbean (excluding high income)Latin America & the Caribbean (IDA & IBRD countries)LatviaLeast developed countries: UN classificationLebanonLiberiaLibyaLithuaniaLow & middle incomeLow incomeLower middle incomeLuxembourgMacao SAR, ChinaMacedonia, FYRMadagascarMalawiMalaysiaMaliMaltaMauritaniaMauritiusMexicoMiddle East & North AfricaMiddle East & North Africa (excluding high income)Middle East & North Africa (IDA & IBRD countries)Middle incomeMoldovaMongoliaMontenegroMoroccoMozambiqueMyanmarNetherlandsNew CaledoniaNew ZealandNicaraguaNigerNigeriaNorth AmericaNorwayOECD membersOmanOther small statesPacific island small statesPakistanPanamaPapua New GuineaParaguayPeruPhilippinesPolandPortugalPost-demographic dividendPre-demographic dividendQatarRomaniaRussian FederationRwandaSaudi ArabiaSenegalSerbiaSeychellesSierra LeoneSingaporeSlovak RepublicSloveniaSmall statesSomaliaSouth AfricaSouth AsiaSouth Asia (IDA & IBRD)SpainSri LankaSt. Kitts and NevisSt. LuciaSt. Vincent and the GrenadinesSub-Saharan Africa Sub-Saharan Africa (excluding high income)Sub-Saharan Africa (IDA & IBRD countries)SudanSurinameSwedenSwitzerlandSyrian Arab RepublicTanzaniaThailandTogoTrinidad and TobagoTunisiaTurkeyUgandaUkraineUnited Arab EmiratesUnited KingdomUnited StatesUpper middle incomeUruguayVenezuela, RBVietnamWorldYemen, Rep.ZambiaZimbabwe Timeline:
This timeline shows a graph from 1961 to 2015 of North America. No data until 1960. Number of actual observations by date: 55.
Source name:
World Development Indicators
Source organization:
World Bank staff estimates based data from International Monetary Fund's Direction of Trade database.
Categories, topics:
Private Sector, Trade
Last updated:
apr 23, 2017
Indicators value changes by year
Minimum:
12.143
jan 1, 1972
Maximum:
43.958
jan 1, 2011
At the date of observation
Value
Absolute change
Change from previous value
jan 1, 1961
20.597
+20.597
0.0%
jan 1, 1962
19.616
-0.981
-4.76%
jan 1, 1963
18.966
-0.65
-3.31%
jan 1, 1964
18.927
-0.039
-0.21%
jan 1, 1965
18.92
-0.006
-0.03%
jan 1, 1966
16.797
-2.123
-11.22%
jan 1, 1967
16.284
-0.513
-3.06%
jan 1, 1968
14.941
-1.343
-8.25%
jan 1, 1969
13.847
-1.094
-7.32%
jan 1, 1970
12.889
-0.958
-6.92%
jan 1, 1971
12.9
+0.012
0.09%
jan 1, 1972
12.143
-0.757
-5.87%
jan 1, 1973
12.275
+0.132
1.09%
jan 1, 1974
13.724
+1.449
11.81%
jan 1, 1975
18.781
+5.057
36.85%
jan 1, 1976
20.0
+1.219
6.49%
jan 1, 1977
21.315
+1.315
6.57%
jan 1, 1978
22.979
+1.664
7.81%
jan 1, 1979
21.756
-1.223
-5.32%
jan 1, 1980
23.419
+1.663
7.65%
jan 1, 1981
24.316
+0.896
3.83%
jan 1, 1982
21.617
-2.699
-11.1%
jan 1, 1983
20.219
-1.398
-6.47%
jan 1, 1984
20.001
-0.218
-1.08%
jan 1, 1985
18.121
-1.88
-9.4%
jan 1, 1986
16.745
-1.377
-7.6%
jan 1, 1987
14.908
-1.837
-10.97%
jan 1, 1988
15.763
+0.855
5.74%
jan 1, 1989
15.848
+0.085
0.54%
jan 1, 1990
17.618
+1.77
11.17%
jan 1, 1991
18.669
+1.051
5.96%
jan 1, 1992
19.146
+0.477
2.56%
jan 1, 1993
20.894
+1.748
9.13%
jan 1, 1994
22.053
+1.159
5.55%
jan 1, 1995
22.978
+0.925
4.19%
jan 1, 1996
24.27
+1.292
5.62%
jan 1, 1997
25.661
+1.39
5.73%
jan 1, 1998
26.863
+1.202
4.69%
jan 1, 1999
27.742
+0.879
3.27%
jan 1, 2000
28.368
+0.626
2.26%
jan 1, 2001
29.687
+1.318
4.65%
jan 1, 2002
30.579
+0.893
3.01%
jan 1, 2003
32.348
+1.769
5.78%
jan 1, 2004
33.837
+1.489
4.6%
jan 1, 2005
35.382
+1.545
4.57%
jan 1, 2006
37.061
+1.679
4.75%
jan 1, 2007
38.972
+1.911
5.16%
jan 1, 2008
39.651
+0.679
1.74%
jan 1, 2009
40.242
+0.591
1.49%
jan 1, 2010
42.565
+2.323
5.77%
jan 1, 2011
43.958
+1.392
3.27%
jan 1, 2012
43.245
-0.712
-1.62%
jan 1, 2013
43.2
-0.045
-0.1%
jan 1, 2014
43.098
-0.102
-0.24%
jan 1, 2015
43.046
-0.053
-0.12%
Ranking of countries by current statistics by years


Comments: