29
/
en
AIzaSyAYiBZKx7MnpbEhh9jyipgxe19OcubqV5w
April 1, 2024
117161
Cyprus
CYP
true
2
1
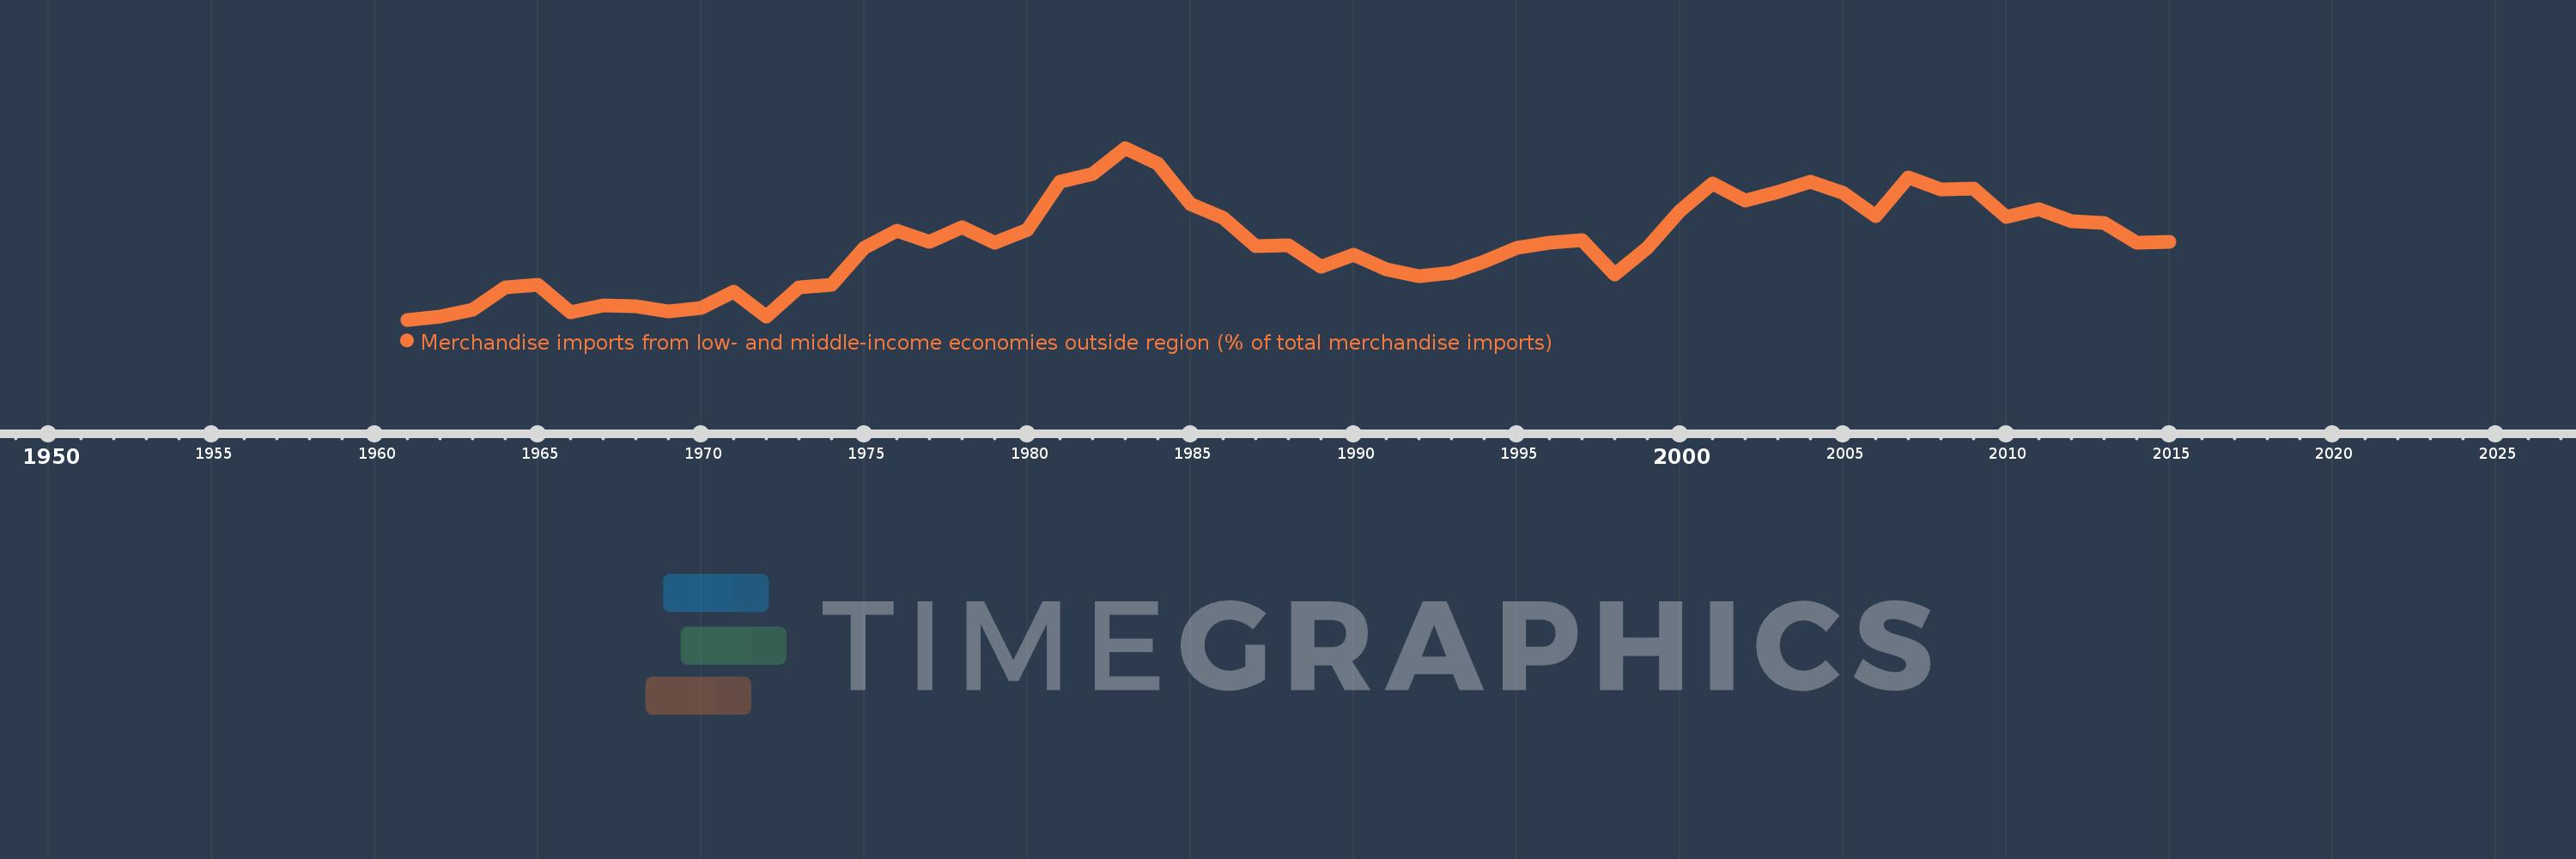
Merchandise imports from low- and middle-income economies outside region (% of total merchandise imports)
2015,2014,2013,2012,2011,2010,2009,2008,2007,2006,2005,2004,2003,2002,2001,2000,1999,1998,1997,1996,1995,1994,1993,1992,1991,1990,1989,1988,1987,1986,1985,1984,1983,1982,1981,1980,1979,1978,1977,1976,1975,1974,1973,1972,1971,1970,1969,1968,1967,1966,1965,1964,1963,1962,1961
This statistics in other country:
AfghanistanAlbaniaAlgeriaAngolaArab WorldArgentinaArmeniaArubaAustraliaAustriaAzerbaijanBahamas, TheBahrainBangladeshBarbadosBelarusBelgiumBelizeBeninBermudaBoliviaBrazilBrunei DarussalamBulgariaBurkina FasoBurundiCabo VerdeCambodiaCameroonCanadaCaribbean small statesCentral African RepublicCentral Europe and the BalticsChileChinaColombiaCongo, Dem. Rep.Congo, Rep.Costa RicaCote d'IvoireCroatiaCubaCyprusCzech RepublicDenmarkDominicaDominican RepublicEarly-demographic dividendEast Asia & PacificEast Asia & Pacific (excluding high income)East Asia & Pacific (IDA & IBRD countries)EcuadorEgypt, Arab Rep.El SalvadorEstoniaEthiopiaEuro areaEurope & Central AsiaEurope & Central Asia (excluding high income)Europe & Central Asia (IDA & IBRD countries)European UnionFijiFinlandFragile and conflict affected situationsFranceGabonGambia, TheGeorgiaGermanyGhanaGreeceGreenlandGrenadaGuatemalaGuineaGuyanaHaitiHeavily indebted poor countries (HIPC)High incomeHondurasHong Kong SAR, ChinaHungaryIBRD onlyIcelandIDA & IBRD totalIDA blendIDA onlyIDA totalIndiaIndonesiaIran, Islamic Rep.IraqIrelandIsraelItalyJamaicaJapanJordanKazakhstanKenyaKorea, Dem. People’s Rep.Korea, Rep.KuwaitKyrgyz RepublicLao PDRLate-demographic dividendLatin America & Caribbean Latin America & Caribbean (excluding high income)Latin America & the Caribbean (IDA & IBRD countries)LatviaLeast developed countries: UN classificationLebanonLiberiaLibyaLithuaniaLow & middle incomeLow incomeLower middle incomeLuxembourgMacao SAR, ChinaMacedonia, FYRMadagascarMalawiMalaysiaMaliMaltaMauritaniaMauritiusMexicoMiddle East & North AfricaMiddle East & North Africa (excluding high income)Middle East & North Africa (IDA & IBRD countries)Middle incomeMoldovaMongoliaMontenegroMoroccoMozambiqueMyanmarNetherlandsNew CaledoniaNew ZealandNicaraguaNigerNigeriaNorth AmericaNorwayOECD membersOmanOther small statesPacific island small statesPakistanPanamaPapua New GuineaParaguayPeruPhilippinesPolandPortugalPost-demographic dividendPre-demographic dividendQatarRomaniaRussian FederationRwandaSaudi ArabiaSenegalSerbiaSeychellesSierra LeoneSingaporeSlovak RepublicSloveniaSmall statesSomaliaSouth AfricaSouth AsiaSouth Asia (IDA & IBRD)SpainSri LankaSt. Kitts and NevisSt. LuciaSt. Vincent and the GrenadinesSub-Saharan Africa Sub-Saharan Africa (excluding high income)Sub-Saharan Africa (IDA & IBRD countries)SudanSurinameSwedenSwitzerlandSyrian Arab RepublicTanzaniaThailandTogoTrinidad and TobagoTunisiaTurkeyUgandaUkraineUnited Arab EmiratesUnited KingdomUnited StatesUpper middle incomeUruguayVenezuela, RBVietnamWorldYemen, Rep.ZambiaZimbabwe Timeline:
This timeline shows a graph from 1961 to 2015 of Cyprus. No data until 1960. Number of actual observations by date: 55.
Source name:
World Development Indicators
Source organization:
World Bank staff estimates based data from International Monetary Fund's Direction of Trade database.
Categories, topics:
Private Sector, Trade
Last updated:
apr 23, 2017
Indicators value changes by year
Maximum:
18.044
jan 1, 1983
At the date of observation
Value
Absolute change
Change from previous value
jan 1, 1961
5.205
+5.205
0.0%
jan 1, 1962
5.437
+0.231
4.44%
jan 1, 1963
5.939
+0.502
9.24%
jan 1, 1964
7.639
+1.7
28.63%
jan 1, 1965
7.832
+0.192
2.52%
jan 1, 1966
5.746
-2.086
-26.63%
jan 1, 1967
6.286
+0.54
9.4%
jan 1, 1968
6.242
-0.044
-0.7%
jan 1, 1969
5.799
-0.443
-7.1%
jan 1, 1970
6.103
+0.304
5.25%
jan 1, 1971
7.298
+1.195
19.57%
jan 1, 1972
5.465
-1.833
-25.12%
jan 1, 1973
7.612
+2.147
39.3%
jan 1, 1974
7.83
+0.218
2.87%
jan 1, 1975
10.568
+2.737
34.96%
jan 1, 1976
11.878
+1.31
12.4%
jan 1, 1977
11.054
-0.823
-6.93%
jan 1, 1978
12.125
+1.071
9.69%
jan 1, 1979
10.966
-1.16
-9.57%
jan 1, 1980
11.902
+0.937
8.54%
jan 1, 1981
15.519
+3.617
30.39%
jan 1, 1982
16.128
+0.609
3.93%
jan 1, 1983
18.044
+1.915
11.88%
jan 1, 1984
16.857
-1.187
-6.58%
jan 1, 1985
13.838
-3.019
-17.91%
jan 1, 1986
12.841
-0.997
-7.2%
jan 1, 1987
10.722
-2.12
-16.51%
jan 1, 1988
10.789
+0.067
0.63%
jan 1, 1989
9.155
-1.634
-15.14%
jan 1, 1990
10.095
+0.94
10.27%
jan 1, 1991
8.956
-1.139
-11.28%
jan 1, 1992
8.476
-0.481
-5.37%
jan 1, 1993
8.705
+0.229
2.71%
jan 1, 1994
9.543
+0.838
9.62%
jan 1, 1995
10.599
+1.056
11.07%
jan 1, 1996
10.932
+0.333
3.14%
jan 1, 1997
11.186
+0.254
2.32%
jan 1, 1998
8.581
-2.605
-23.29%
jan 1, 1999
10.56
+1.979
23.06%
jan 1, 2000
13.332
+2.772
26.25%
jan 1, 2001
15.424
+2.092
15.7%
jan 1, 2002
14.14
-1.284
-8.32%
jan 1, 2003
14.763
+0.623
4.41%
jan 1, 2004
15.522
+0.759
5.14%
jan 1, 2005
14.708
-0.814
-5.25%
jan 1, 2006
12.928
-1.78
-12.1%
jan 1, 2007
15.833
+2.905
22.47%
jan 1, 2008
14.944
-0.89
-5.62%
jan 1, 2009
15.015
+0.071
0.47%
jan 1, 2010
12.886
-2.129
-14.18%
jan 1, 2011
13.469
+0.583
4.53%
jan 1, 2012
12.598
-0.871
-6.47%
jan 1, 2013
12.448
-0.149
-1.18%
jan 1, 2014
10.994
-1.454
-11.68%
jan 1, 2015
11.007
+0.012
0.11%
Ranking of countries by current statistics by years


Comments: