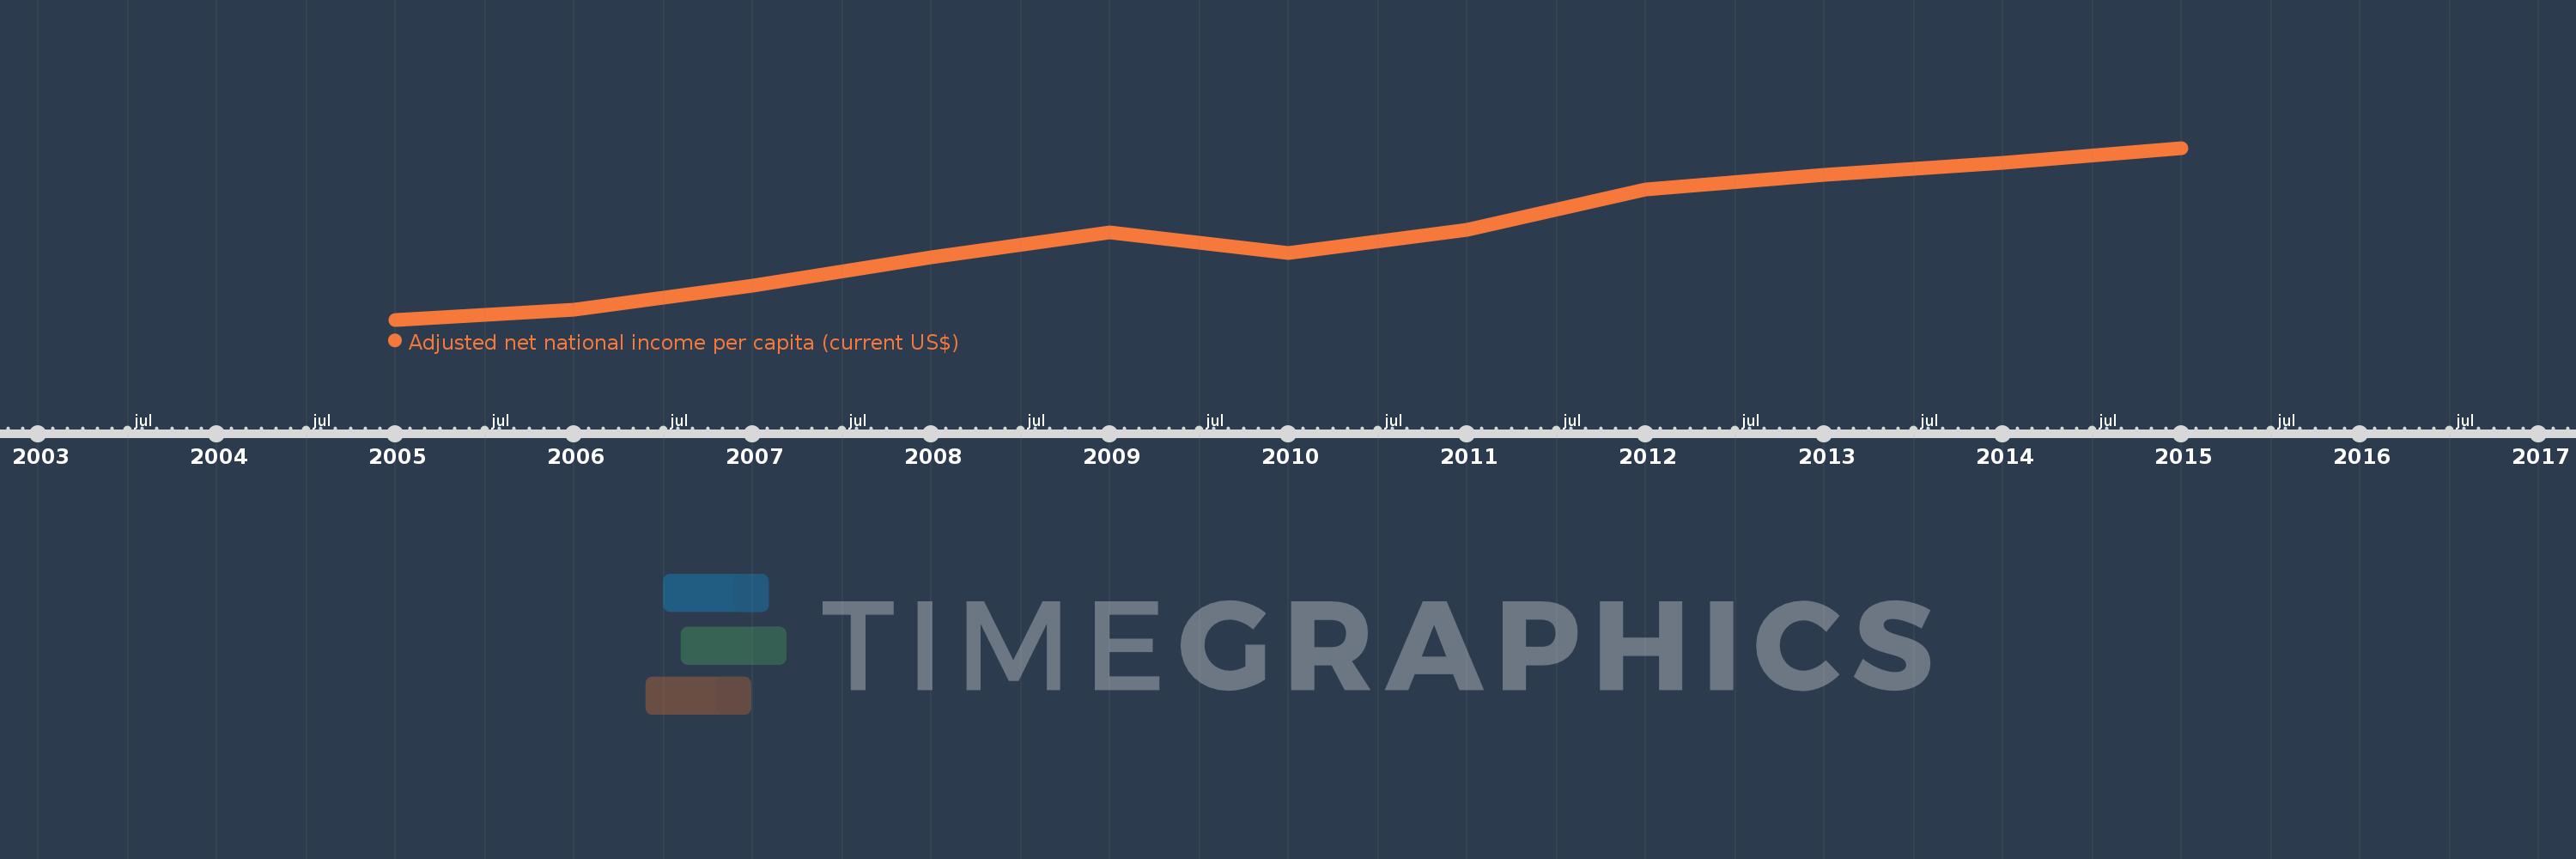
This timeline shows a graph from 2005 to 2015 of Other small states. No data until 2004. Number of actual observations by date: 11.
Source name:
World Development Indicators
Source organization:
World Bank staff estimates based on sources and methods in World Bank's "The Changing Wealth of Nations: Measuring Sustainable Development in the New Millennium" (2011).
Categories, topics:
Economy & Growth
Last updated:
apr 23, 2017
Indicators value changes by year
Meaning:
7.561K
Minimum:
4.303K
jan 1, 2005
Maximum:
10.753K
jan 1, 2015
At the date of observation
Value
Absolute change
Change from the previous value
jan 1, 2005
4.303K
+4.303K
0.0%
jan 1, 2006
4.677K
+373.833
8.69%
jan 1, 2007
5.576K
+898.859
19.22%
jan 1, 2008
6.662K
+1.086K
19.47%
jan 1, 2009
7.586K
+923.471
13.86%
jan 1, 2010
6.819K
-766.273
-10.1%
jan 1, 2011
7.672K
+852.869
12.51%
jan 1, 2012
9.181K
+1.508K
19.66%
jan 1, 2013
9.755K
+574.26
6.26%
jan 1, 2014
10.187K
+432.547
4.43%
jan 1, 2015
10.753K
+565.204
5.55%
Ranking of countries by current statistics by years
