29
/
en
AIzaSyAYiBZKx7MnpbEhh9jyipgxe19OcubqV5w
April 1, 2024
243293
Solomon Islands
SLB
true
2
1
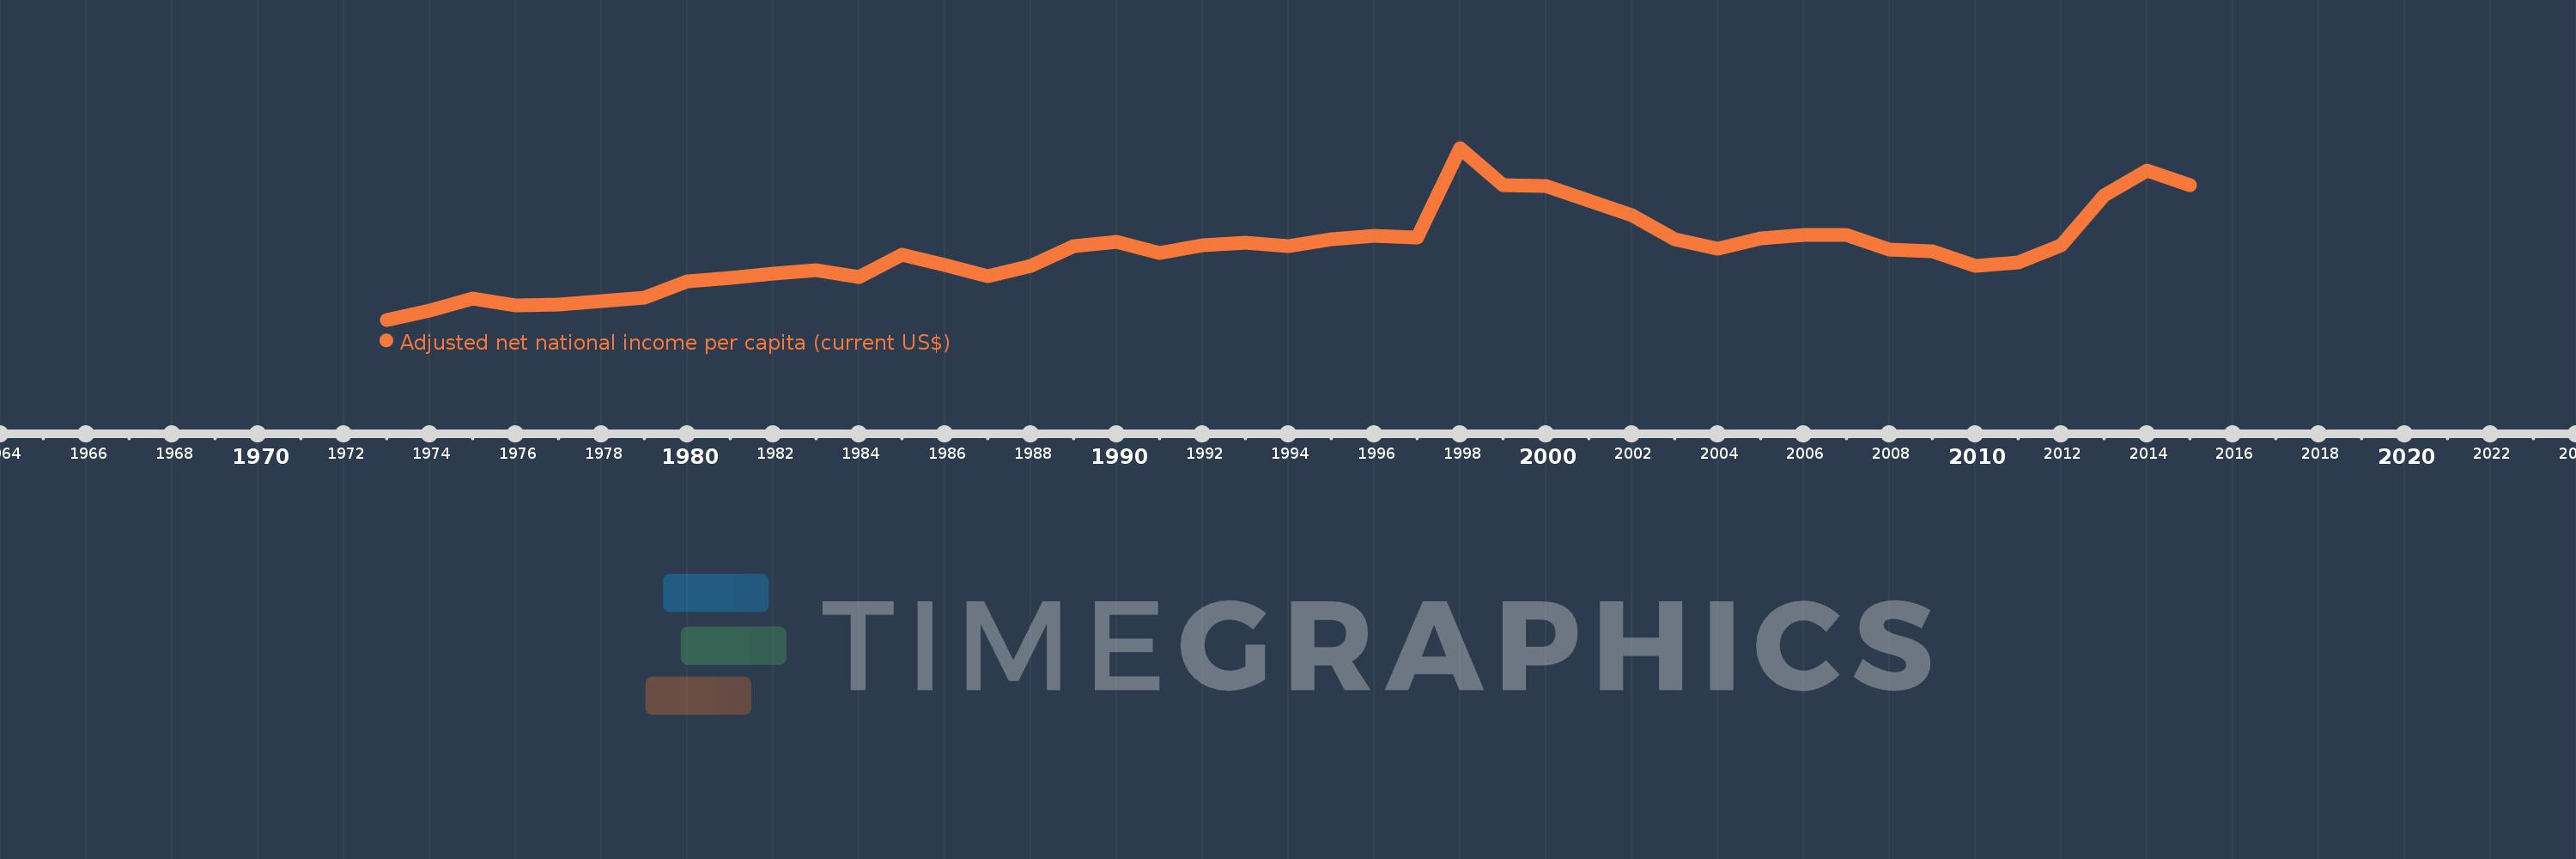
Adjusted net national income per capita (current US$)
2015,2014,2013,2012,2011,2010,2009,2008,2007,2006,2005,2004,2003,2002,2001,2000,1999,1998,1997,1996,1995,1994,1993,1992,1991,1990,1989,1988,1987,1986,1985,1984,1983,1982,1981,1980,1979,1978,1977,1976,1975,1974,1973
This statistics in other country:
AfghanistanAlbaniaAlgeriaAngolaArab WorldArgentinaArmeniaAustraliaAustriaAzerbaijanBahamas, TheBahrainBangladeshBarbadosBelarusBelgiumBelizeBeninBhutanBoliviaBotswanaBrazilBrunei DarussalamBulgariaBurkina FasoBurundiCabo VerdeCambodiaCameroonCanadaCaribbean small statesCentral African RepublicCentral Europe and the BalticsChadChileChinaColombiaComorosCongo, Dem. Rep.Congo, Rep.Costa RicaCote d'IvoireCroatiaCubaCyprusCzech RepublicDenmarkDjiboutiDominicaDominican RepublicEarly-demographic dividendEast Asia & PacificEast Asia & Pacific (excluding high income)East Asia & Pacific (IDA & IBRD countries)EcuadorEgypt, Arab Rep.El SalvadorEquatorial GuineaEritreaEstoniaEthiopiaEuro areaEurope & Central AsiaEurope & Central Asia (excluding high income)Europe & Central Asia (IDA & IBRD countries)European UnionFijiFinlandFragile and conflict affected situationsFranceGabonGambia, TheGeorgiaGermanyGhanaGreeceGuatemalaGuineaGuinea-BissauGuyanaHaitiHeavily indebted poor countries (HIPC)High incomeHondurasHong Kong SAR, ChinaHungaryIBRD onlyIcelandIDA & IBRD totalIDA blendIDA onlyIDA totalIndiaIndonesiaIran, Islamic Rep.IraqIrelandIsraelItalyJamaicaJapanJordanKazakhstanKenyaKiribatiKorea, Rep.KuwaitKyrgyz RepublicLao PDRLate-demographic dividendLatin America & Caribbean Latin America & Caribbean (excluding high income)Latin America & the Caribbean (IDA & IBRD countries)LatviaLeast developed countries: UN classificationLebanonLesothoLiberiaLibyaLithuaniaLow & middle incomeLow incomeLower middle incomeLuxembourgMacedonia, FYRMadagascarMalawiMalaysiaMaldivesMaliMauritaniaMauritiusMexicoMiddle East & North AfricaMiddle East & North Africa (excluding high income)Middle East & North Africa (IDA & IBRD countries)Middle incomeMoldovaMongoliaMoroccoMozambiqueMyanmarNamibiaNepalNetherlandsNew ZealandNicaraguaNigerNigeriaNorth AmericaNorwayOECD membersOmanOther small statesPacific island small statesPakistanPanamaPapua New GuineaParaguayPeruPhilippinesPolandPortugalPost-demographic dividendPre-demographic dividendQatarRomaniaRussian FederationRwandaSamoaSao Tome and PrincipeSaudi ArabiaSenegalSeychellesSierra LeoneSingaporeSlovak RepublicSloveniaSmall statesSolomon IslandsSouth AfricaSouth AsiaSouth Asia (IDA & IBRD)SpainSri LankaSt. LuciaSt. Vincent and the GrenadinesSub-Saharan Africa Sub-Saharan Africa (excluding high income)Sub-Saharan Africa (IDA & IBRD countries)SudanSurinameSwazilandSwedenSwitzerlandSyrian Arab RepublicTajikistanTanzaniaThailandTogoTongaTrinidad and TobagoTunisiaTurkeyTurkmenistanUgandaUkraineUnited Arab EmiratesUnited KingdomUnited StatesUpper middle incomeUruguayUzbekistanVanuatuVenezuela, RBVietnamWorldYemen, Rep.ZambiaZimbabwe Timeline:
This timeline shows a graph from 1973 to 2015 of Solomon Islands. No data until 1972. Number of actual observations by date: 43.
Source name:
World Development Indicators
Source organization:
World Bank staff estimates based on sources and methods in World Bank's "The Changing Wealth of Nations: Measuring Sustainable Development in the New Millennium" (2011).
Categories, topics:
Economy & Growth
Last updated:
apr 23, 2017
Indicators value changes by year
Minimum:
135.966
jan 1, 1973
Maximum:
1.308K
jan 1, 1998
At the date of observation
Value
Absolute change
Change from previous value
jan 1, 1973
135.966
+135.966
0.0%
jan 1, 1974
195.914
+59.948
44.09%
jan 1, 1975
283.35
+87.437
44.63%
jan 1, 1976
235.447
-47.903
-16.91%
jan 1, 1977
241.809
+6.362
2.7%
jan 1, 1978
264.701
+22.893
9.47%
jan 1, 1979
289.014
+24.312
9.18%
jan 1, 1980
398.718
+109.704
37.96%
jan 1, 1981
421.092
+22.375
5.61%
jan 1, 1982
453.426
+32.333
7.68%
jan 1, 1983
474.056
+20.63
4.55%
jan 1, 1984
425.202
-48.854
-10.31%
jan 1, 1985
581.791
+156.589
36.83%
jan 1, 1986
506.35
-75.442
-12.97%
jan 1, 1987
431.268
-75.082
-14.83%
jan 1, 1988
504.885
+73.618
17.07%
jan 1, 1989
637.326
+132.44
26.23%
jan 1, 1990
665.918
+28.593
4.49%
jan 1, 1991
591.88
-74.039
-11.12%
jan 1, 1992
644.235
+52.355
8.85%
jan 1, 1993
658.866
+14.632
2.27%
jan 1, 1994
636.186
-22.68
-3.44%
jan 1, 1995
683.013
+46.827
7.36%
jan 1, 1996
708.037
+25.024
3.66%
jan 1, 1997
699.385
-8.652
-1.22%
jan 1, 1998
1.308K
+608.342
86.98%
jan 1, 1999
1.052K
-255.997
-19.58%
jan 1, 2000
1.051K
-0.733
-0.07%
jan 1, 2001
946.528
-104.469
-9.94%
jan 1, 2002
846.403
-100.125
-10.58%
jan 1, 2003
687.849
-158.553
-18.73%
jan 1, 2004
622.779
-65.07
-9.46%
jan 1, 2005
693.666
+70.887
11.38%
jan 1, 2006
715.876
+22.21
3.2%
jan 1, 2007
711.707
-4.169
-0.58%
jan 1, 2008
614.402
-97.304
-13.67%
jan 1, 2009
604.592
-9.81
-1.6%
jan 1, 2010
504.454
-100.138
-16.56%
jan 1, 2011
525.185
+20.73
4.11%
jan 1, 2012
641.218
+116.034
22.09%
jan 1, 2013
983.398
+342.18
53.36%
jan 1, 2014
1.154K
+170.766
17.36%
jan 1, 2015
1.056K
-98.656
-8.55%
Ranking of countries by current statistics by years


Comments: