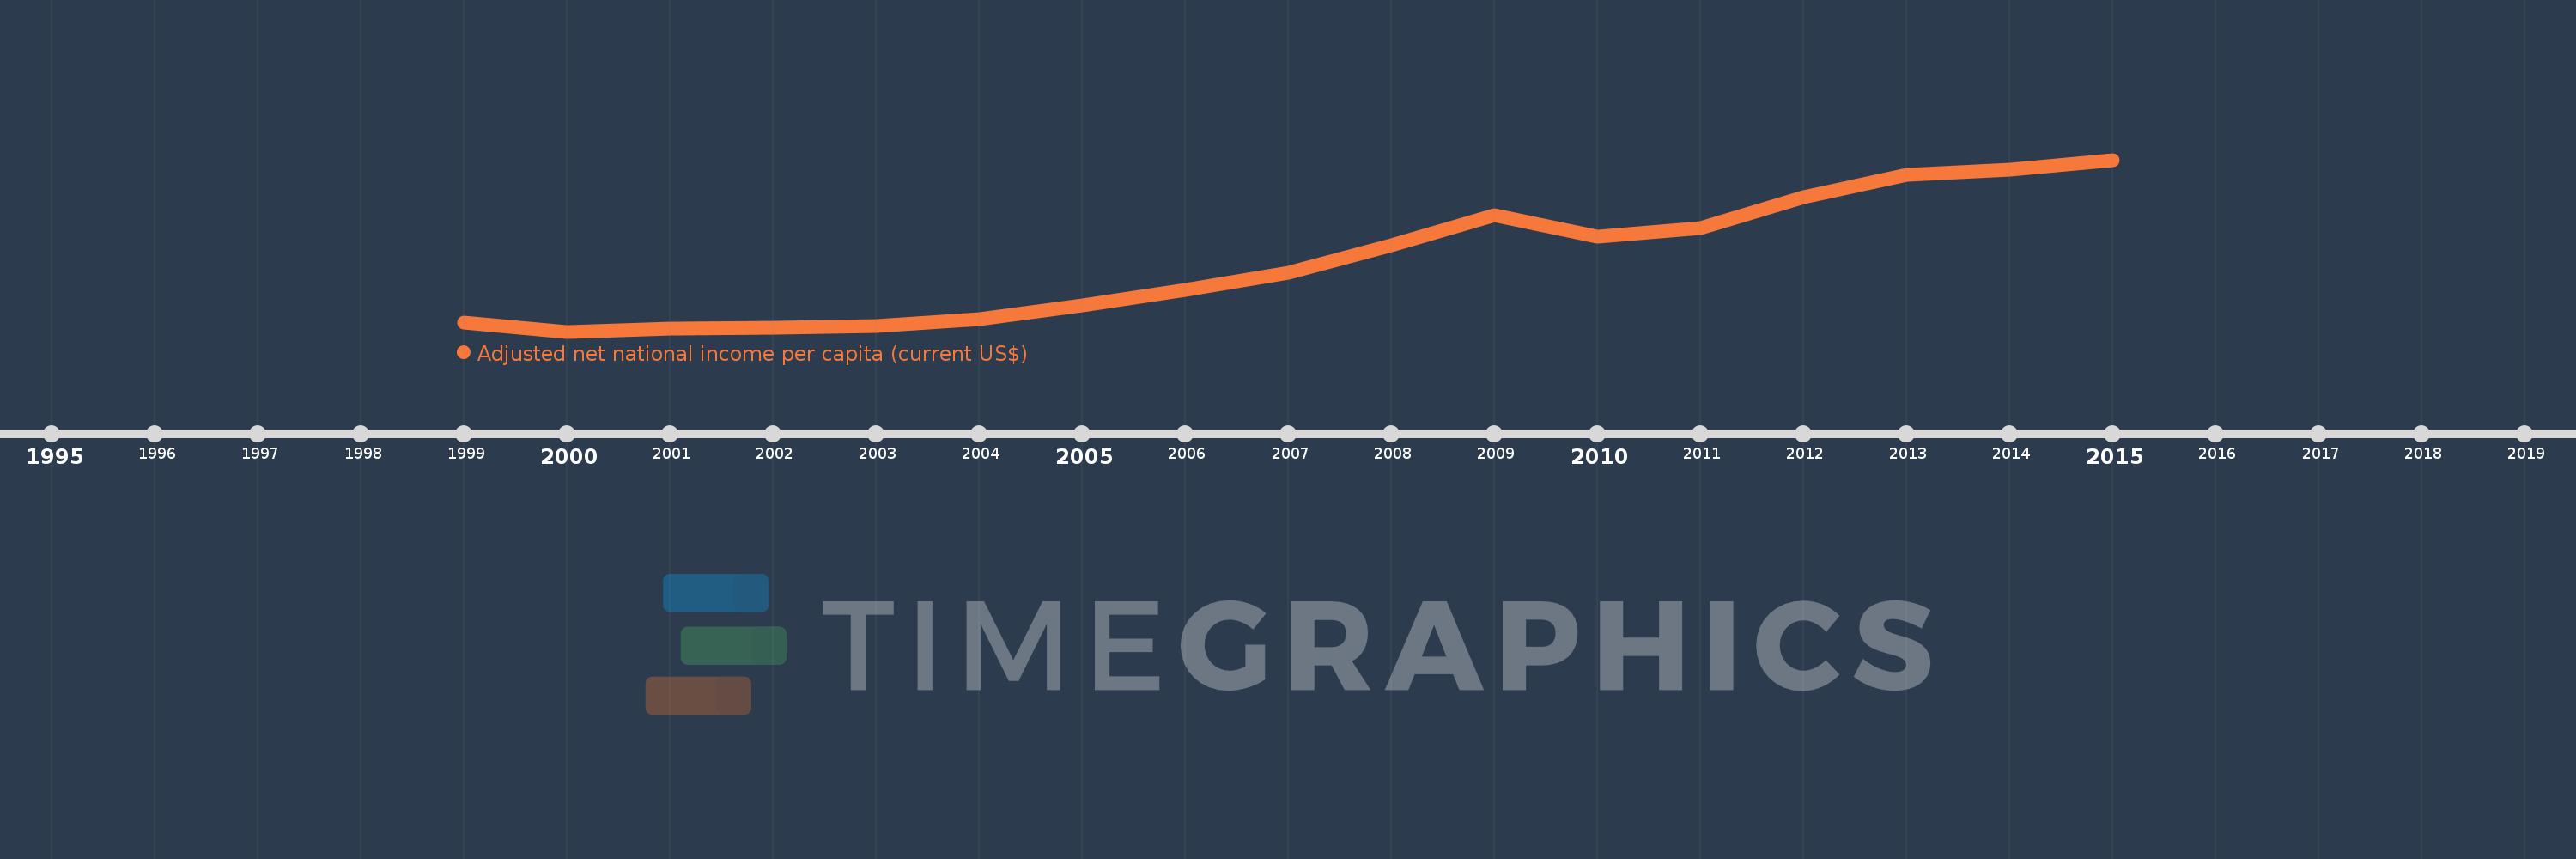
This timeline shows a graph from 1999 to 2015 of Georgia. No data until 1998. Number of actual observations by date: 17.
Source name:
World Development Indicators
Source organization:
World Bank staff estimates based on sources and methods in World Bank's "The Changing Wealth of Nations: Measuring Sustainable Development in the New Millennium" (2011).
Categories, topics:
Economy & Growth
Last updated:
apr 23, 2017
Indicators value changes by year
Meaning:
1.935K
Minimum:
587.027
jan 1, 2000
Maximum:
3.9K
jan 1, 2015
At the date of observation
Value
Absolute change
Change from the previous value
jan 1, 1999
764.074
+764.074
0.0%
jan 1, 2000
587.027
-177.048
-23.17%
jan 1, 2001
642.858
+55.831
9.51%
jan 1, 2002
661.438
+18.58
2.89%
jan 1, 2003
697.219
+35.781
5.41%
jan 1, 2004
825.253
+128.034
18.36%
jan 1, 2005
1.1K
+274.652
33.28%
jan 1, 2006
1.391K
+291.572
26.51%
jan 1, 2007
1.723K
+331.698
23.84%
jan 1, 2008
2.25K
+526.994
30.58%
jan 1, 2009
2.835K
+584.776
25.99%
jan 1, 2010
2.418K
-417.394
-14.72%
jan 1, 2011
2.586K
+168.84
6.98%
jan 1, 2012
3.182K
+595.785
23.04%
jan 1, 2013
3.618K
+435.447
13.68%
jan 1, 2014
3.71K
+92.391
2.55%
jan 1, 2015
3.9K
+190.002
5.12%
Ranking of countries by current statistics by years
