29
/
en
AIzaSyAYiBZKx7MnpbEhh9jyipgxe19OcubqV5w
April 1, 2024
130043
Ethiopia
ETH
true
2
1
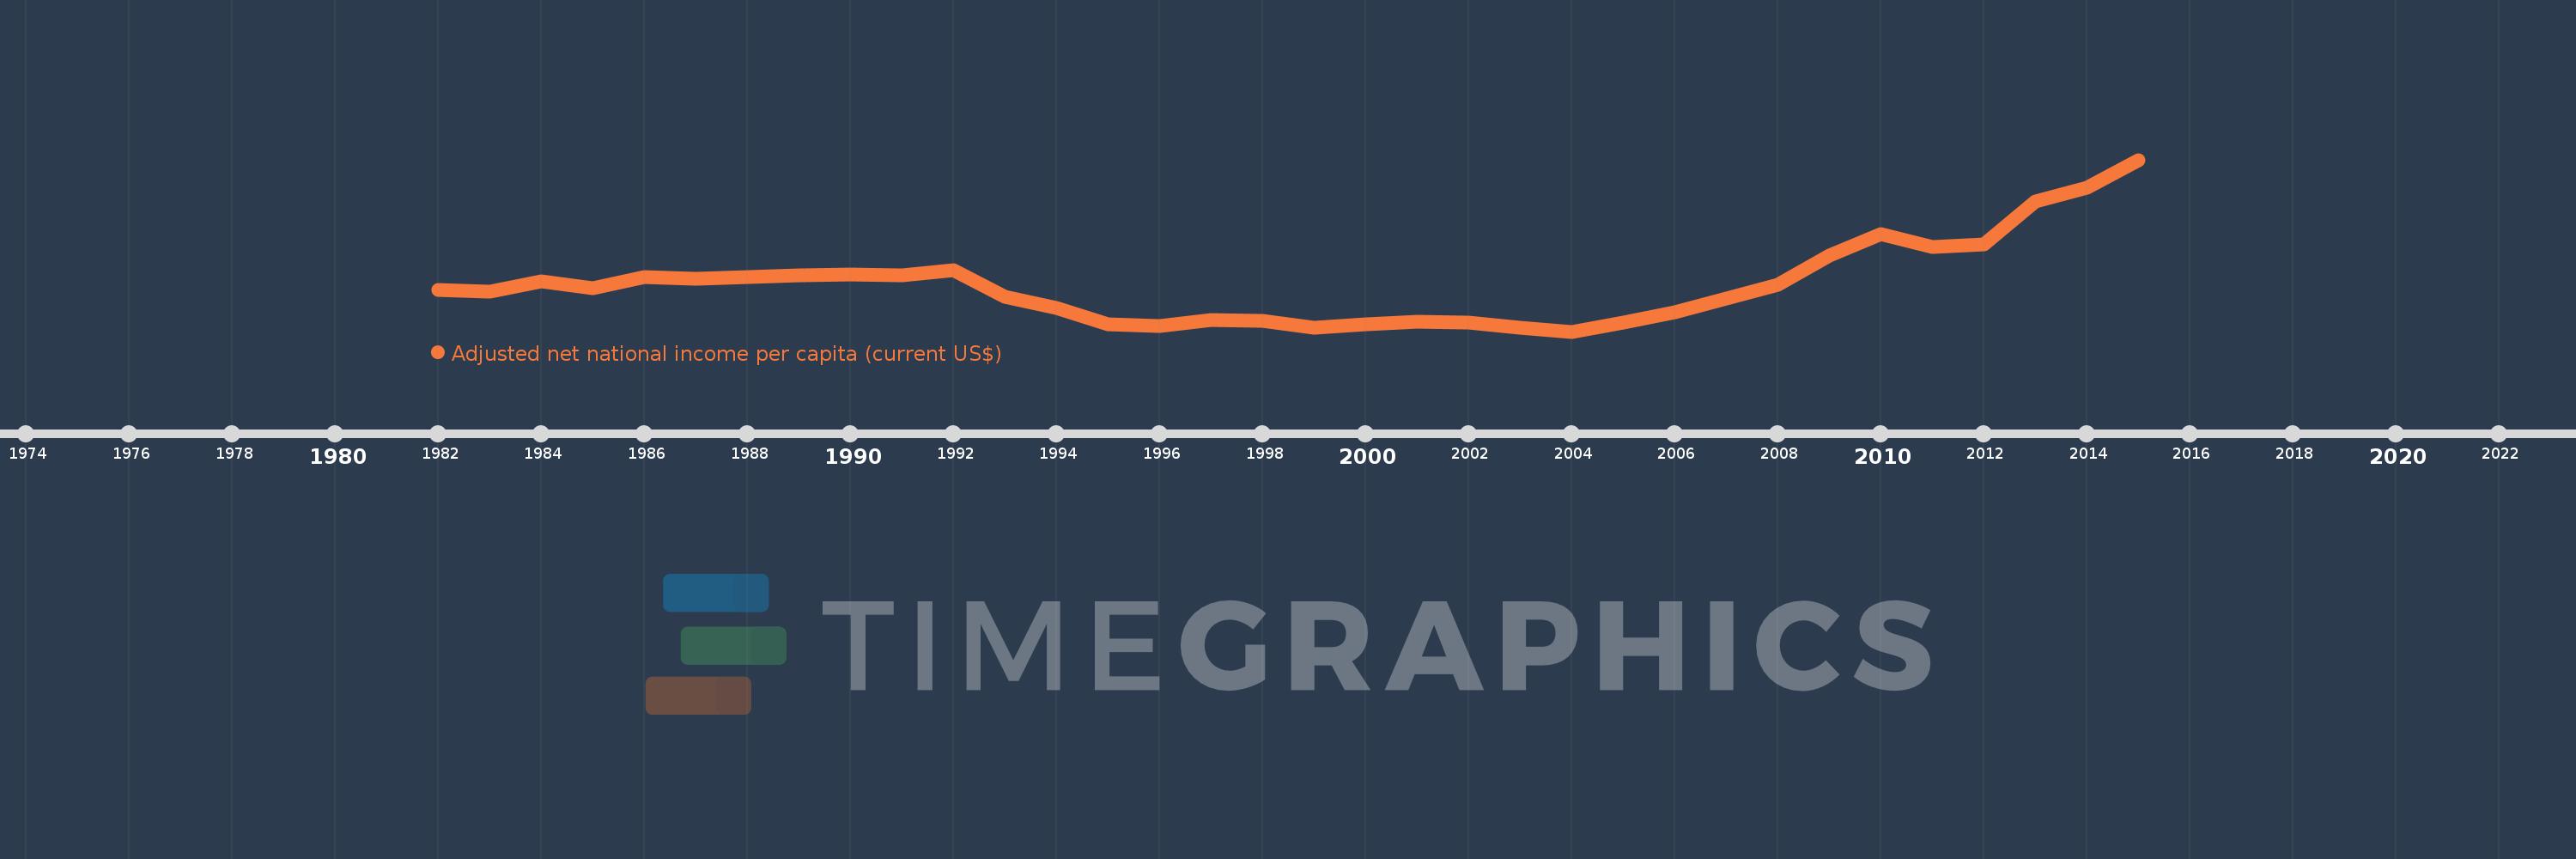
Adjusted net national income per capita (current US$)
2015,2014,2013,2012,2011,2010,2009,2008,2007,2006,2005,2004,2003,2002,2001,2000,1999,1998,1997,1996,1995,1994,1993,1992,1991,1990,1989,1988,1987,1986,1985,1984,1983,1982
This statistics in other country:
AfghanistanAlbaniaAlgeriaAngolaArab WorldArgentinaArmeniaAustraliaAustriaAzerbaijanBahamas, TheBahrainBangladeshBarbadosBelarusBelgiumBelizeBeninBhutanBoliviaBotswanaBrazilBrunei DarussalamBulgariaBurkina FasoBurundiCabo VerdeCambodiaCameroonCanadaCaribbean small statesCentral African RepublicCentral Europe and the BalticsChadChileChinaColombiaComorosCongo, Dem. Rep.Congo, Rep.Costa RicaCote d'IvoireCroatiaCubaCyprusCzech RepublicDenmarkDjiboutiDominicaDominican RepublicEarly-demographic dividendEast Asia & PacificEast Asia & Pacific (excluding high income)East Asia & Pacific (IDA & IBRD countries)EcuadorEgypt, Arab Rep.El SalvadorEquatorial GuineaEritreaEstoniaEthiopiaEuro areaEurope & Central AsiaEurope & Central Asia (excluding high income)Europe & Central Asia (IDA & IBRD countries)European UnionFijiFinlandFragile and conflict affected situationsFranceGabonGambia, TheGeorgiaGermanyGhanaGreeceGuatemalaGuineaGuinea-BissauGuyanaHaitiHeavily indebted poor countries (HIPC)High incomeHondurasHong Kong SAR, ChinaHungaryIBRD onlyIcelandIDA & IBRD totalIDA blendIDA onlyIDA totalIndiaIndonesiaIran, Islamic Rep.IraqIrelandIsraelItalyJamaicaJapanJordanKazakhstanKenyaKiribatiKorea, Rep.KuwaitKyrgyz RepublicLao PDRLate-demographic dividendLatin America & Caribbean Latin America & Caribbean (excluding high income)Latin America & the Caribbean (IDA & IBRD countries)LatviaLeast developed countries: UN classificationLebanonLesothoLiberiaLibyaLithuaniaLow & middle incomeLow incomeLower middle incomeLuxembourgMacedonia, FYRMadagascarMalawiMalaysiaMaldivesMaliMauritaniaMauritiusMexicoMiddle East & North AfricaMiddle East & North Africa (excluding high income)Middle East & North Africa (IDA & IBRD countries)Middle incomeMoldovaMongoliaMoroccoMozambiqueMyanmarNamibiaNepalNetherlandsNew ZealandNicaraguaNigerNigeriaNorth AmericaNorwayOECD membersOmanOther small statesPacific island small statesPakistanPanamaPapua New GuineaParaguayPeruPhilippinesPolandPortugalPost-demographic dividendPre-demographic dividendQatarRomaniaRussian FederationRwandaSamoaSao Tome and PrincipeSaudi ArabiaSenegalSeychellesSierra LeoneSingaporeSlovak RepublicSloveniaSmall statesSolomon IslandsSouth AfricaSouth AsiaSouth Asia (IDA & IBRD)SpainSri LankaSt. LuciaSt. Vincent and the GrenadinesSub-Saharan Africa Sub-Saharan Africa (excluding high income)Sub-Saharan Africa (IDA & IBRD countries)SudanSurinameSwazilandSwedenSwitzerlandSyrian Arab RepublicTajikistanTanzaniaThailandTogoTongaTrinidad and TobagoTunisiaTurkeyTurkmenistanUgandaUkraineUnited Arab EmiratesUnited KingdomUnited StatesUpper middle incomeUruguayUzbekistanVanuatuVenezuela, RBVietnamWorldYemen, Rep.ZambiaZimbabwe Timeline:
This timeline shows a graph from 1982 to 2015 of Ethiopia. No data until 1981. Number of actual observations by date: 34.
Source name:
World Development Indicators
Source organization:
World Bank staff estimates based on sources and methods in World Bank's "The Changing Wealth of Nations: Measuring Sustainable Development in the New Millennium" (2011).
Categories, topics:
Economy & Growth
Last updated:
apr 23, 2017
Indicators value changes by year
Minimum:
70.772
jan 1, 2004
Maximum:
477.045
jan 1, 2015
At the date of observation
Value
Absolute change
Change from previous value
jan 1, 1982
169.079
+169.079
0.0%
jan 1, 1983
165.161
-3.918
-2.32%
jan 1, 1984
189.589
+24.428
14.79%
jan 1, 1985
172.944
-16.645
-8.78%
jan 1, 1986
200.258
+27.314
15.79%
jan 1, 1987
195.56
-4.698
-2.35%
jan 1, 1988
200.264
+4.704
2.41%
jan 1, 1989
204.038
+3.774
1.88%
jan 1, 1990
205.851
+1.813
0.89%
jan 1, 1991
204.285
-1.567
-0.76%
jan 1, 1992
215.973
+11.689
5.72%
jan 1, 1993
153.234
-62.739
-29.05%
jan 1, 1994
127.65
-25.584
-16.7%
jan 1, 1995
87.964
-39.686
-31.09%
jan 1, 1996
84.814
-3.151
-3.58%
jan 1, 1997
97.223
+12.409
14.63%
jan 1, 1998
95.424
-1.798
-1.85%
jan 1, 1999
79.782
-15.642
-16.39%
jan 1, 2000
88.447
+8.664
10.86%
jan 1, 2001
93.569
+5.122
5.79%
jan 1, 2002
91.651
-1.918
-2.05%
jan 1, 2003
79.763
-11.888
-12.97%
jan 1, 2004
70.772
-8.991
-11.27%
jan 1, 2005
91.895
+21.123
29.85%
jan 1, 2006
116.826
+24.931
27.13%
jan 1, 2007
148.19
+31.364
26.85%
jan 1, 2008
180.522
+32.331
21.82%
jan 1, 2009
250.805
+70.284
38.93%
jan 1, 2010
300.405
+49.599
19.78%
jan 1, 2011
271.416
-28.989
-9.65%
jan 1, 2012
277.863
+6.447
2.38%
jan 1, 2013
377.893
+100.03
36.0%
jan 1, 2014
410.8
+32.907
8.71%
jan 1, 2015
477.045
+66.246
16.13%
Ranking of countries by current statistics by years


Comments: