29
/
en
AIzaSyAYiBZKx7MnpbEhh9jyipgxe19OcubqV5w
April 1, 2024
154174
India
IND
true
2
1
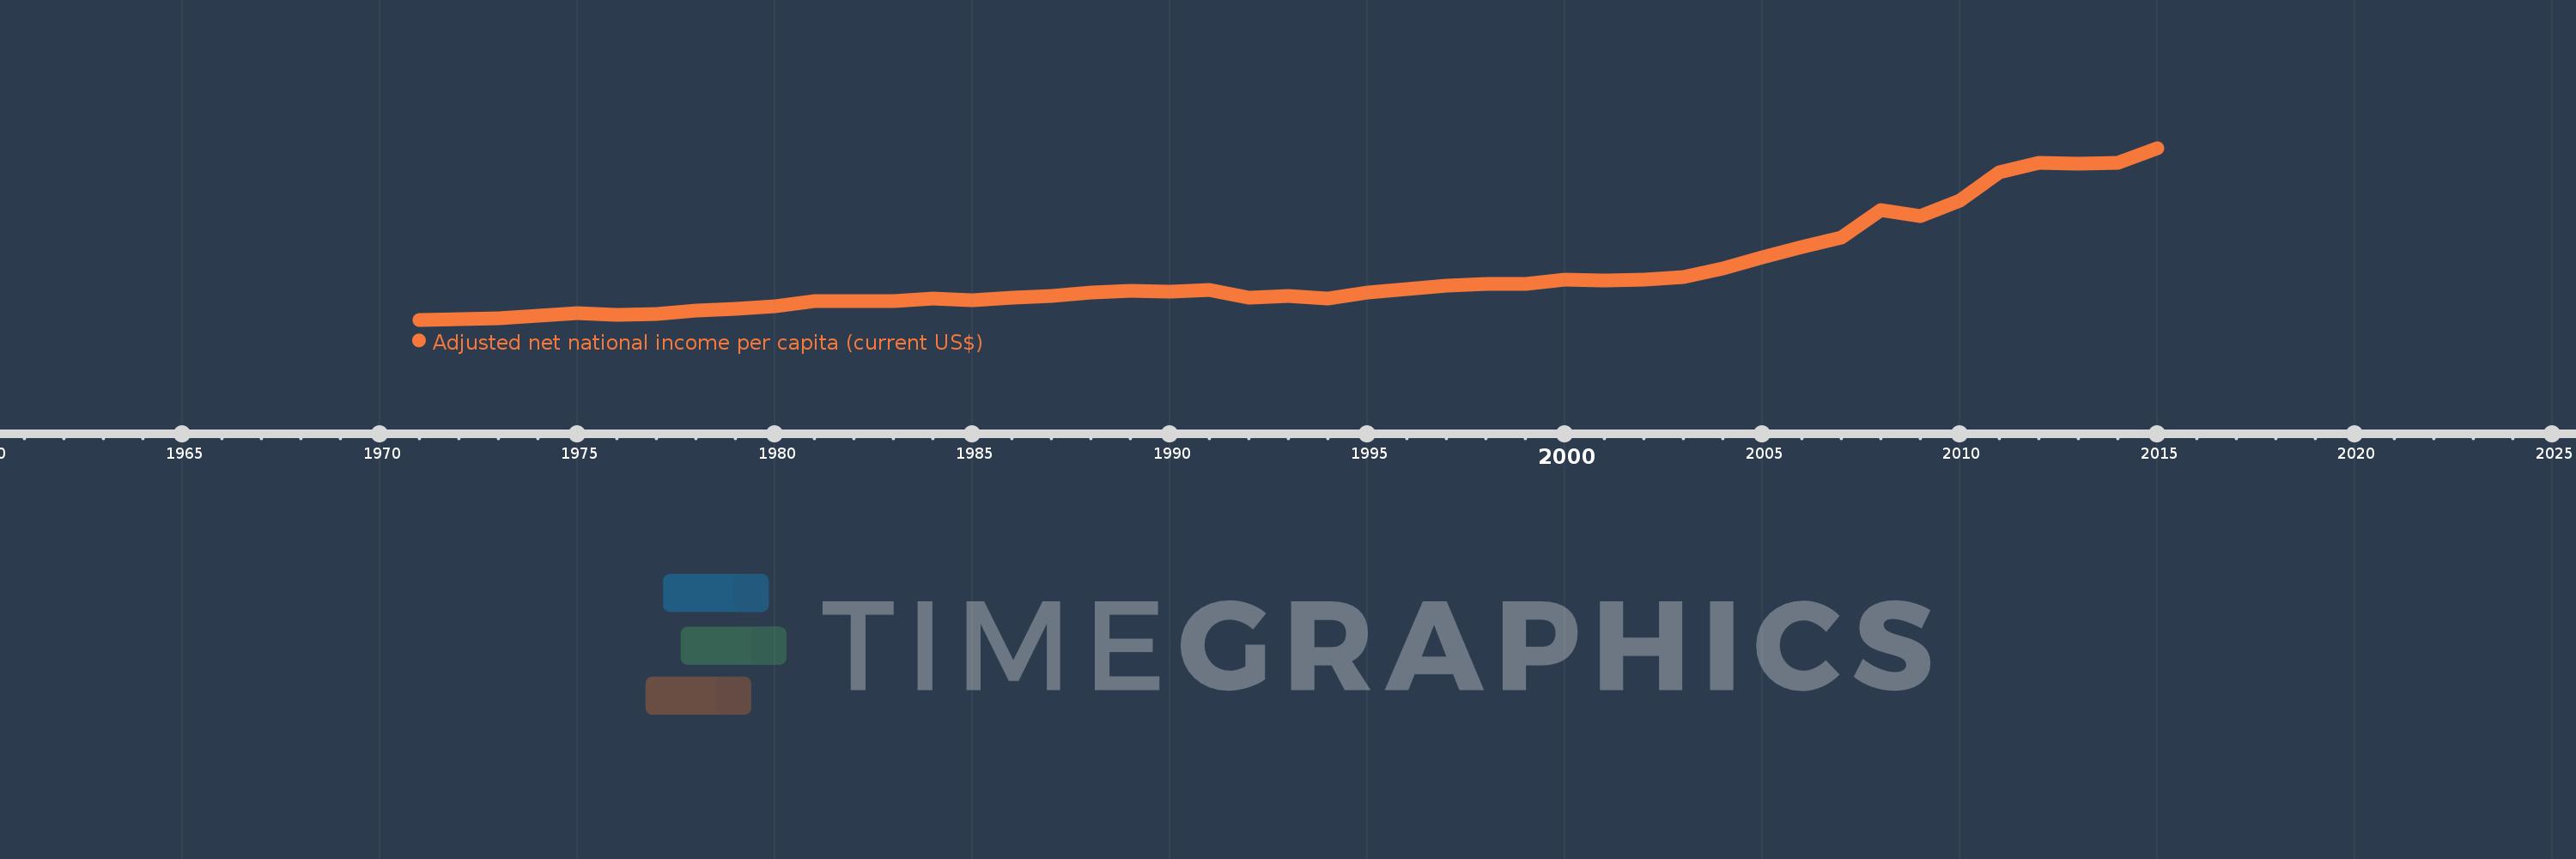
Adjusted net national income per capita (current US$)
2015,2014,2013,2012,2011,2010,2009,2008,2007,2006,2005,2004,2003,2002,2001,2000,1999,1998,1997,1996,1995,1994,1993,1992,1991,1990,1989,1988,1987,1986,1985,1984,1983,1982,1981,1980,1979,1978,1977,1976,1975,1974,1973,1972,1971
This statistics in other country:
AfghanistanAlbaniaAlgeriaAngolaArab WorldArgentinaArmeniaAustraliaAustriaAzerbaijanBahamas, TheBahrainBangladeshBarbadosBelarusBelgiumBelizeBeninBhutanBoliviaBotswanaBrazilBrunei DarussalamBulgariaBurkina FasoBurundiCabo VerdeCambodiaCameroonCanadaCaribbean small statesCentral African RepublicCentral Europe and the BalticsChadChileChinaColombiaComorosCongo, Dem. Rep.Congo, Rep.Costa RicaCote d'IvoireCroatiaCubaCyprusCzech RepublicDenmarkDjiboutiDominicaDominican RepublicEarly-demographic dividendEast Asia & PacificEast Asia & Pacific (excluding high income)East Asia & Pacific (IDA & IBRD countries)EcuadorEgypt, Arab Rep.El SalvadorEquatorial GuineaEritreaEstoniaEthiopiaEuro areaEurope & Central AsiaEurope & Central Asia (excluding high income)Europe & Central Asia (IDA & IBRD countries)European UnionFijiFinlandFragile and conflict affected situationsFranceGabonGambia, TheGeorgiaGermanyGhanaGreeceGuatemalaGuineaGuinea-BissauGuyanaHaitiHeavily indebted poor countries (HIPC)High incomeHondurasHong Kong SAR, ChinaHungaryIBRD onlyIcelandIDA & IBRD totalIDA blendIDA onlyIDA totalIndiaIndonesiaIran, Islamic Rep.IraqIrelandIsraelItalyJamaicaJapanJordanKazakhstanKenyaKiribatiKorea, Rep.KuwaitKyrgyz RepublicLao PDRLate-demographic dividendLatin America & Caribbean Latin America & Caribbean (excluding high income)Latin America & the Caribbean (IDA & IBRD countries)LatviaLeast developed countries: UN classificationLebanonLesothoLiberiaLibyaLithuaniaLow & middle incomeLow incomeLower middle incomeLuxembourgMacedonia, FYRMadagascarMalawiMalaysiaMaldivesMaliMauritaniaMauritiusMexicoMiddle East & North AfricaMiddle East & North Africa (excluding high income)Middle East & North Africa (IDA & IBRD countries)Middle incomeMoldovaMongoliaMoroccoMozambiqueMyanmarNamibiaNepalNetherlandsNew ZealandNicaraguaNigerNigeriaNorth AmericaNorwayOECD membersOmanOther small statesPacific island small statesPakistanPanamaPapua New GuineaParaguayPeruPhilippinesPolandPortugalPost-demographic dividendPre-demographic dividendQatarRomaniaRussian FederationRwandaSamoaSao Tome and PrincipeSaudi ArabiaSenegalSeychellesSierra LeoneSingaporeSlovak RepublicSloveniaSmall statesSolomon IslandsSouth AfricaSouth AsiaSouth Asia (IDA & IBRD)SpainSri LankaSt. LuciaSt. Vincent and the GrenadinesSub-Saharan Africa Sub-Saharan Africa (excluding high income)Sub-Saharan Africa (IDA & IBRD countries)SudanSurinameSwazilandSwedenSwitzerlandSyrian Arab RepublicTajikistanTanzaniaThailandTogoTongaTrinidad and TobagoTunisiaTurkeyTurkmenistanUgandaUkraineUnited Arab EmiratesUnited KingdomUnited StatesUpper middle incomeUruguayUzbekistanVanuatuVenezuela, RBVietnamWorldYemen, Rep.ZambiaZimbabwe Timeline:
This timeline shows a graph from 1971 to 2015 of India. No data until 1970. Number of actual observations by date: 45.
Source name:
World Development Indicators
Source organization:
World Bank staff estimates based on sources and methods in World Bank's "The Changing Wealth of Nations: Measuring Sustainable Development in the New Millennium" (2011).
Categories, topics:
Economy & Growth
Last updated:
apr 23, 2017
Indicators value changes by year
Minimum:
104.932
jan 1, 1971
Maximum:
1.352K
jan 1, 2015
At the date of observation
Value
Absolute change
Change from previous value
jan 1, 1971
104.932
+104.932
0.0%
jan 1, 1972
110.917
+5.985
5.7%
jan 1, 1973
114.852
+3.934
3.55%
jan 1, 1974
134.008
+19.156
16.68%
jan 1, 1975
150.998
+16.99
12.68%
jan 1, 1976
140.985
-10.013
-6.63%
jan 1, 1977
146.454
+5.469
3.88%
jan 1, 1978
168.997
+22.543
15.39%
jan 1, 1979
186.714
+17.716
10.48%
jan 1, 1980
200.483
+13.77
7.37%
jan 1, 1981
239.18
+38.697
19.3%
jan 1, 1982
241.218
+2.039
0.85%
jan 1, 1983
238.895
-2.324
-0.96%
jan 1, 1984
258.501
+19.607
8.21%
jan 1, 1985
244.075
-14.427
-5.58%
jan 1, 1986
262.558
+18.483
7.57%
jan 1, 1987
275.934
+13.377
5.09%
jan 1, 1988
303.261
+27.327
9.9%
jan 1, 1989
315.145
+11.883
3.92%
jan 1, 1990
306.049
-9.095
-2.89%
jan 1, 1991
321.745
+15.696
5.13%
jan 1, 1992
262.159
-59.586
-18.52%
jan 1, 1993
274.932
+12.772
4.87%
jan 1, 1994
261.542
-13.39
-4.87%
jan 1, 1995
303.468
+41.926
16.03%
jan 1, 1996
326.122
+22.655
7.47%
jan 1, 1997
350.261
+24.138
7.4%
jan 1, 1998
365.365
+15.104
4.31%
jan 1, 1999
366.431
+1.067
0.29%
jan 1, 2000
393.331
+26.899
7.34%
jan 1, 2001
390.001
-3.33
-0.85%
jan 1, 2002
396.824
+6.823
1.75%
jan 1, 2003
413.946
+17.122
4.31%
jan 1, 2004
480.116
+66.17
15.99%
jan 1, 2005
555.471
+75.355
15.7%
jan 1, 2006
630.76
+75.288
13.55%
jan 1, 2007
702.207
+71.448
11.33%
jan 1, 2008
902.544
+200.336
28.53%
jan 1, 2009
859.331
-43.213
-4.79%
jan 1, 2010
972.579
+113.248
13.18%
jan 1, 2011
1.177K
+204.032
20.98%
jan 1, 2012
1.247K
+70.494
5.99%
jan 1, 2013
1.236K
-11.292
-0.91%
jan 1, 2014
1.246K
+10.509
0.85%
jan 1, 2015
1.352K
+105.737
8.48%
Ranking of countries by current statistics by years


Comments: