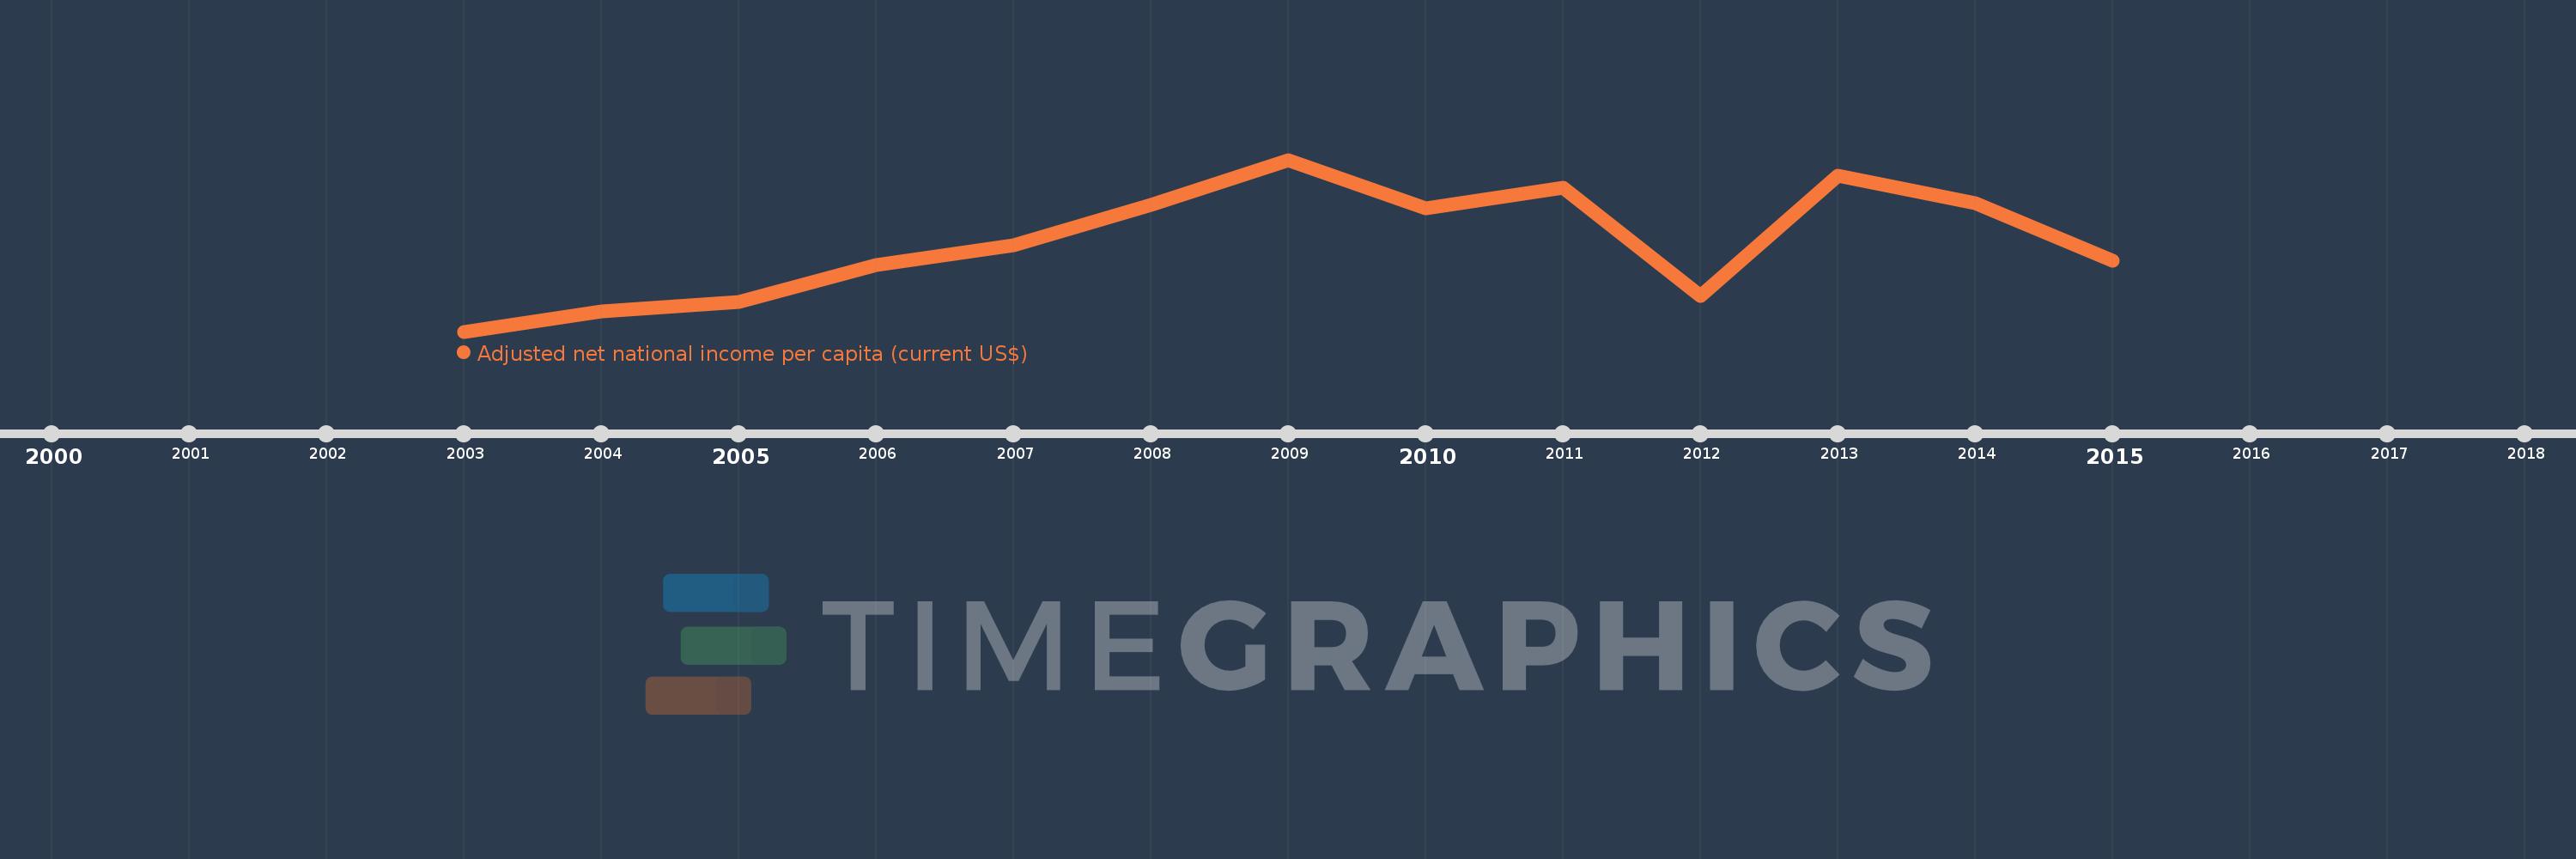
This timeline shows a graph from 2003 to 2015 of Libya. No data until 2002. Number of actual observations by date: 13.
Source name:
World Development Indicators
Source organization:
World Bank staff estimates based on sources and methods in World Bank's "The Changing Wealth of Nations: Measuring Sustainable Development in the New Millennium" (2011).
Categories, topics:
Economy & Growth
Last updated:
apr 23, 2017
Indicators value changes by year
Meaning:
5.752K
Minimum:
2.602K
jan 1, 2003
Maximum:
8.669K
jan 1, 2009
At the date of observation
Value
Absolute change
Change from the previous value
jan 1, 2003
2.602K
+2.602K
0.0%
jan 1, 2004
3.302K
+699.702
26.89%
jan 1, 2005
3.659K
+357.189
10.82%
jan 1, 2006
4.963K
+1.304K
35.63%
jan 1, 2007
5.664K
+701.619
14.14%
jan 1, 2008
7.076K
+1.412K
24.93%
jan 1, 2009
8.669K
+1.592K
22.5%
jan 1, 2010
6.958K
-1.711K
-19.73%
jan 1, 2011
7.683K
+724.985
10.42%
jan 1, 2012
3.862K
-3.821K
-49.74%
jan 1, 2013
8.104K
+4.242K
109.85%
jan 1, 2014
7.139K
-964.311
-11.9%
jan 1, 2015
5.091K
-2.048K
-28.69%
Ranking of countries by current statistics by years
