29
/
en
AIzaSyAYiBZKx7MnpbEhh9jyipgxe19OcubqV5w
April 1, 2024
38701
IDA only
IDX
false
2
1
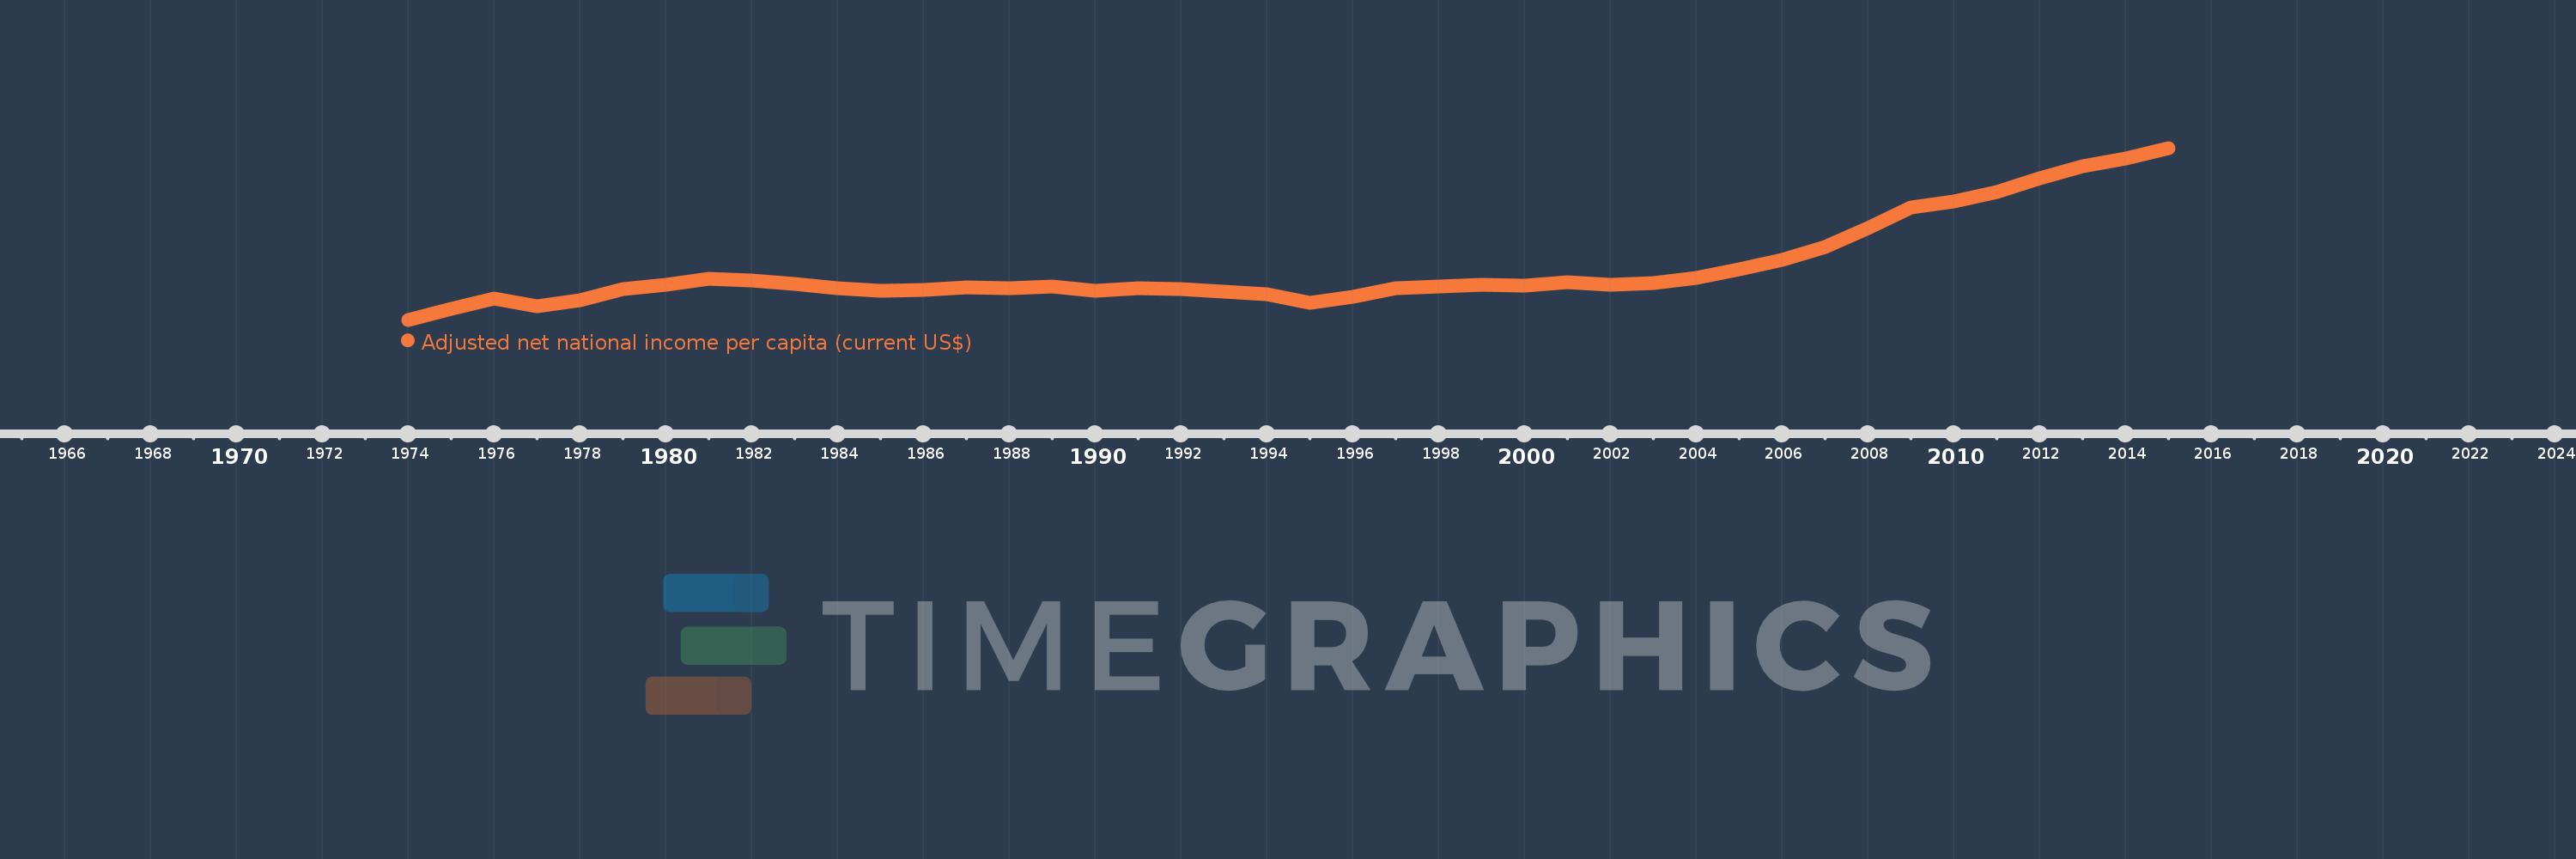
Adjusted net national income per capita (current US$)
2015,2014,2013,2012,2011,2010,2009,2008,2007,2006,2005,2004,2003,2002,2001,2000,1999,1998,1997,1996,1995,1994,1993,1992,1991,1990,1989,1988,1987,1986,1985,1984,1983,1982,1981,1980,1979,1978,1977,1976,1975,1974
This statistics in other country:
AfghanistanAlbaniaAlgeriaAngolaArab WorldArgentinaArmeniaAustraliaAustriaAzerbaijanBahamas, TheBahrainBangladeshBarbadosBelarusBelgiumBelizeBeninBhutanBoliviaBotswanaBrazilBrunei DarussalamBulgariaBurkina FasoBurundiCabo VerdeCambodiaCameroonCanadaCaribbean small statesCentral African RepublicCentral Europe and the BalticsChadChileChinaColombiaComorosCongo, Dem. Rep.Congo, Rep.Costa RicaCote d'IvoireCroatiaCubaCyprusCzech RepublicDenmarkDjiboutiDominicaDominican RepublicEarly-demographic dividendEast Asia & PacificEast Asia & Pacific (excluding high income)East Asia & Pacific (IDA & IBRD countries)EcuadorEgypt, Arab Rep.El SalvadorEquatorial GuineaEritreaEstoniaEthiopiaEuro areaEurope & Central AsiaEurope & Central Asia (excluding high income)Europe & Central Asia (IDA & IBRD countries)European UnionFijiFinlandFragile and conflict affected situationsFranceGabonGambia, TheGeorgiaGermanyGhanaGreeceGuatemalaGuineaGuinea-BissauGuyanaHaitiHeavily indebted poor countries (HIPC)High incomeHondurasHong Kong SAR, ChinaHungaryIBRD onlyIcelandIDA & IBRD totalIDA blendIDA onlyIDA totalIndiaIndonesiaIran, Islamic Rep.IraqIrelandIsraelItalyJamaicaJapanJordanKazakhstanKenyaKiribatiKorea, Rep.KuwaitKyrgyz RepublicLao PDRLate-demographic dividendLatin America & Caribbean Latin America & Caribbean (excluding high income)Latin America & the Caribbean (IDA & IBRD countries)LatviaLeast developed countries: UN classificationLebanonLesothoLiberiaLibyaLithuaniaLow & middle incomeLow incomeLower middle incomeLuxembourgMacedonia, FYRMadagascarMalawiMalaysiaMaldivesMaliMauritaniaMauritiusMexicoMiddle East & North AfricaMiddle East & North Africa (excluding high income)Middle East & North Africa (IDA & IBRD countries)Middle incomeMoldovaMongoliaMoroccoMozambiqueMyanmarNamibiaNepalNetherlandsNew ZealandNicaraguaNigerNigeriaNorth AmericaNorwayOECD membersOmanOther small statesPacific island small statesPakistanPanamaPapua New GuineaParaguayPeruPhilippinesPolandPortugalPost-demographic dividendPre-demographic dividendQatarRomaniaRussian FederationRwandaSamoaSao Tome and PrincipeSaudi ArabiaSenegalSeychellesSierra LeoneSingaporeSlovak RepublicSloveniaSmall statesSolomon IslandsSouth AfricaSouth AsiaSouth Asia (IDA & IBRD)SpainSri LankaSt. LuciaSt. Vincent and the GrenadinesSub-Saharan Africa Sub-Saharan Africa (excluding high income)Sub-Saharan Africa (IDA & IBRD countries)SudanSurinameSwazilandSwedenSwitzerlandSyrian Arab RepublicTajikistanTanzaniaThailandTogoTongaTrinidad and TobagoTunisiaTurkeyTurkmenistanUgandaUkraineUnited Arab EmiratesUnited KingdomUnited StatesUpper middle incomeUruguayUzbekistanVanuatuVenezuela, RBVietnamWorldYemen, Rep.ZambiaZimbabwe Timeline:
This timeline shows a graph from 1974 to 2015 of IDA only. No data until 1973. Number of actual observations by date: 42.
Source name:
World Development Indicators
Source organization:
World Bank staff estimates based on sources and methods in World Bank's "The Changing Wealth of Nations: Measuring Sustainable Development in the New Millennium" (2011).
Categories, topics:
Economy & Growth
Last updated:
apr 23, 2017
Indicators value changes by year
Minimum:
168.019
jan 1, 1974
Maximum:
852.404
jan 1, 2015
At the date of observation
Value
Absolute change
Change from previous value
jan 1, 1974
168.019
+168.019
0.0%
jan 1, 1975
211.272
+43.253
25.74%
jan 1, 1976
253.724
+42.452
20.09%
jan 1, 1977
223.029
-30.694
-12.1%
jan 1, 1978
245.637
+22.607
10.14%
jan 1, 1979
288.751
+43.115
17.55%
jan 1, 1980
307.702
+18.951
6.56%
jan 1, 1981
329.562
+21.86
7.1%
jan 1, 1982
324.612
-4.95
-1.5%
jan 1, 1983
309.876
-14.736
-4.54%
jan 1, 1984
294.555
-15.321
-4.94%
jan 1, 1985
282.539
-12.016
-4.08%
jan 1, 1986
287.712
+5.173
1.83%
jan 1, 1987
296.432
+8.72
3.03%
jan 1, 1988
295.144
-1.288
-0.43%
jan 1, 1989
299.917
+4.773
1.62%
jan 1, 1990
284.12
-15.797
-5.27%
jan 1, 1991
294.227
+10.107
3.56%
jan 1, 1992
291.496
-2.731
-0.93%
jan 1, 1993
278.404
-13.092
-4.49%
jan 1, 1994
270.938
-7.466
-2.68%
jan 1, 1995
234.04
-36.898
-13.62%
jan 1, 1996
260.552
+26.512
11.33%
jan 1, 1997
295.09
+34.538
13.26%
jan 1, 1998
301.592
+6.502
2.2%
jan 1, 1999
307.519
+5.927
1.97%
jan 1, 2000
303.775
-3.744
-1.22%
jan 1, 2001
318.34
+14.566
4.79%
jan 1, 2002
305.824
-12.516
-3.93%
jan 1, 2003
312.637
+6.813
2.23%
jan 1, 2004
333.844
+21.206
6.78%
jan 1, 2005
369.648
+35.804
10.72%
jan 1, 2006
407.25
+37.602
10.17%
jan 1, 2007
458.482
+51.232
12.58%
jan 1, 2008
533.34
+74.857
16.33%
jan 1, 2009
615.684
+82.344
15.44%
jan 1, 2010
638.297
+22.613
3.67%
jan 1, 2011
678.384
+40.087
6.28%
jan 1, 2012
730.829
+52.445
7.73%
jan 1, 2013
781.039
+50.21
6.87%
jan 1, 2014
811.507
+30.467
3.9%
jan 1, 2015
852.404
+40.898
5.04%
Ranking of countries by current statistics by years


Comments: