29
/
en
AIzaSyAYiBZKx7MnpbEhh9jyipgxe19OcubqV5w
April 1, 2024
235303
Senegal
SEN
true
2
1
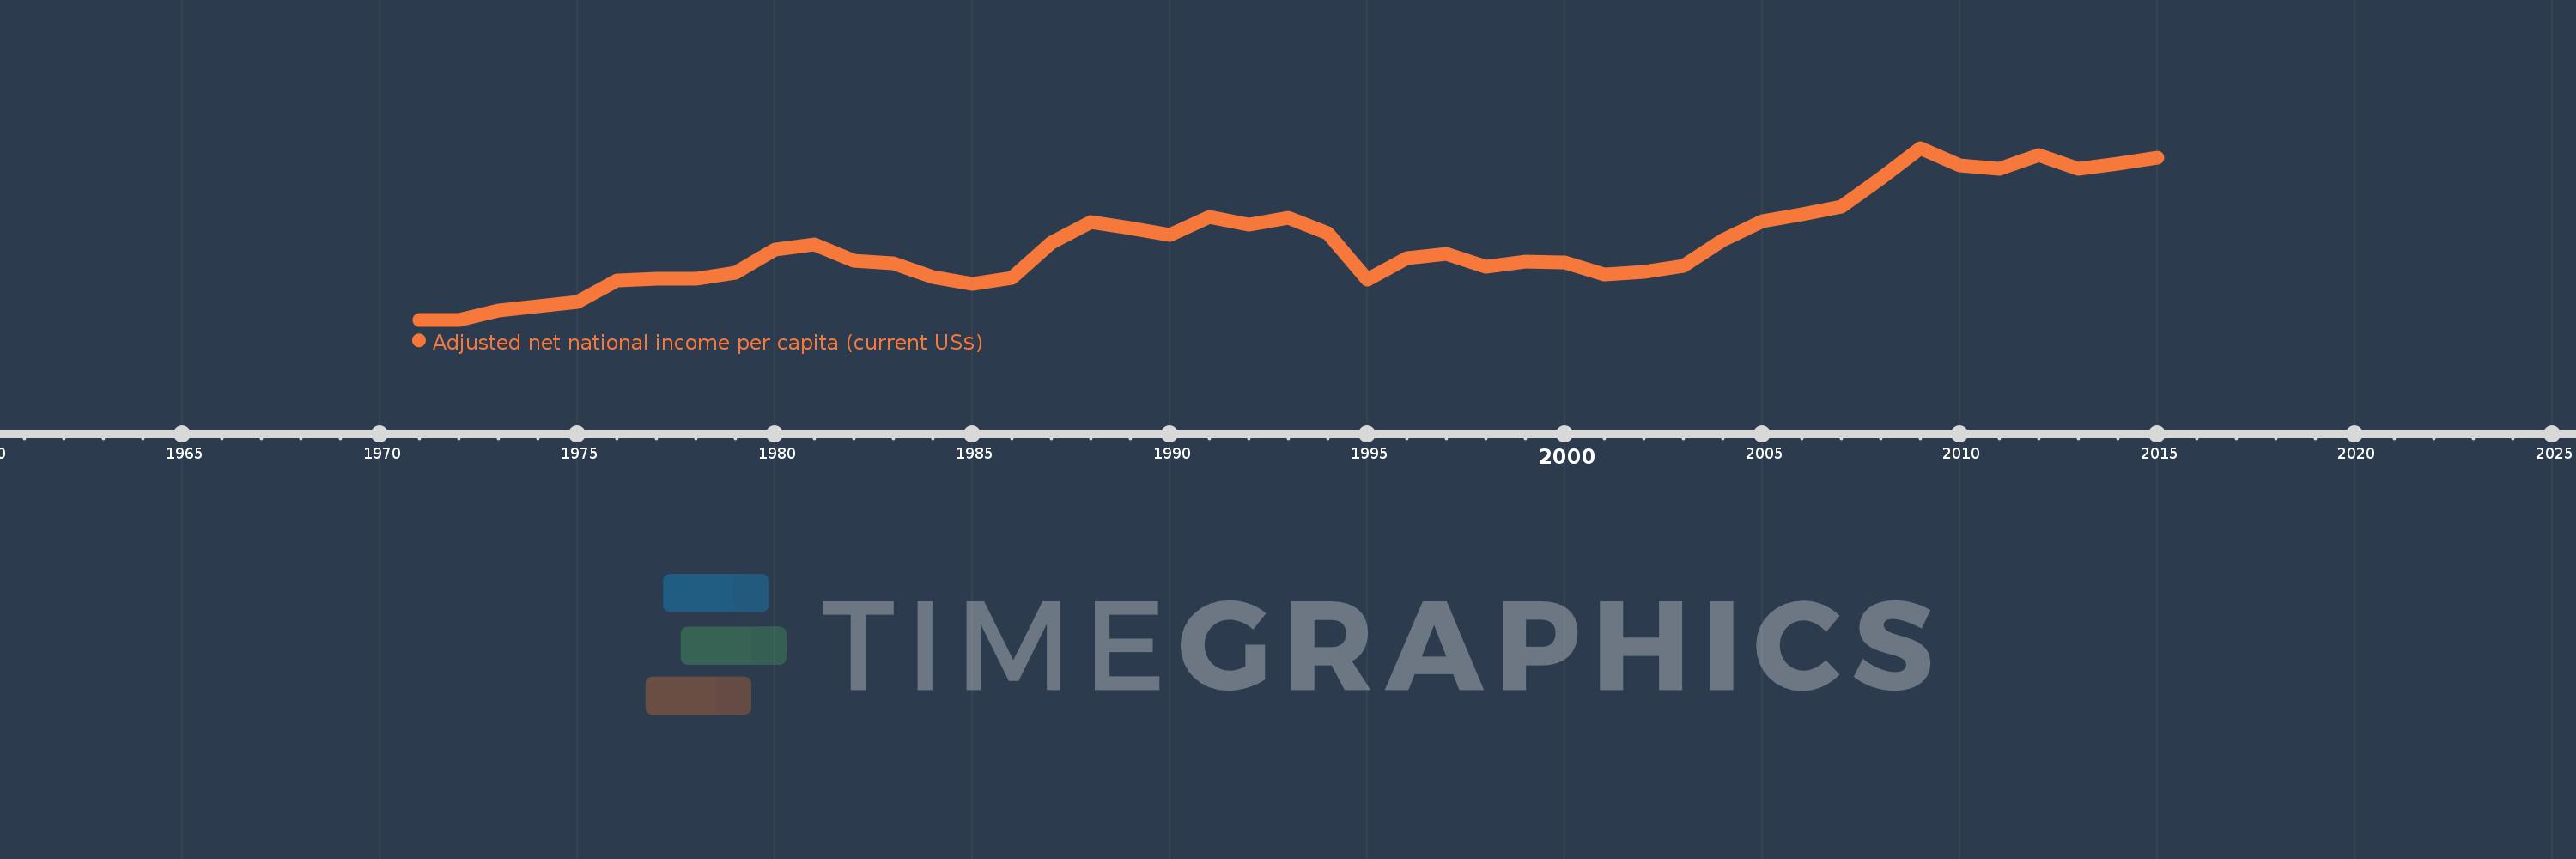
Adjusted net national income per capita (current US$)
2015,2014,2013,2012,2011,2010,2009,2008,2007,2006,2005,2004,2003,2002,2001,2000,1999,1998,1997,1996,1995,1994,1993,1992,1991,1990,1989,1988,1987,1986,1985,1984,1983,1982,1981,1980,1979,1978,1977,1976,1975,1974,1973,1972,1971
This statistics in other country:
AfghanistanAlbaniaAlgeriaAngolaArab WorldArgentinaArmeniaAustraliaAustriaAzerbaijanBahamas, TheBahrainBangladeshBarbadosBelarusBelgiumBelizeBeninBhutanBoliviaBotswanaBrazilBrunei DarussalamBulgariaBurkina FasoBurundiCabo VerdeCambodiaCameroonCanadaCaribbean small statesCentral African RepublicCentral Europe and the BalticsChadChileChinaColombiaComorosCongo, Dem. Rep.Congo, Rep.Costa RicaCote d'IvoireCroatiaCubaCyprusCzech RepublicDenmarkDjiboutiDominicaDominican RepublicEarly-demographic dividendEast Asia & PacificEast Asia & Pacific (excluding high income)East Asia & Pacific (IDA & IBRD countries)EcuadorEgypt, Arab Rep.El SalvadorEquatorial GuineaEritreaEstoniaEthiopiaEuro areaEurope & Central AsiaEurope & Central Asia (excluding high income)Europe & Central Asia (IDA & IBRD countries)European UnionFijiFinlandFragile and conflict affected situationsFranceGabonGambia, TheGeorgiaGermanyGhanaGreeceGuatemalaGuineaGuinea-BissauGuyanaHaitiHeavily indebted poor countries (HIPC)High incomeHondurasHong Kong SAR, ChinaHungaryIBRD onlyIcelandIDA & IBRD totalIDA blendIDA onlyIDA totalIndiaIndonesiaIran, Islamic Rep.IraqIrelandIsraelItalyJamaicaJapanJordanKazakhstanKenyaKiribatiKorea, Rep.KuwaitKyrgyz RepublicLao PDRLate-demographic dividendLatin America & Caribbean Latin America & Caribbean (excluding high income)Latin America & the Caribbean (IDA & IBRD countries)LatviaLeast developed countries: UN classificationLebanonLesothoLiberiaLibyaLithuaniaLow & middle incomeLow incomeLower middle incomeLuxembourgMacedonia, FYRMadagascarMalawiMalaysiaMaldivesMaliMauritaniaMauritiusMexicoMiddle East & North AfricaMiddle East & North Africa (excluding high income)Middle East & North Africa (IDA & IBRD countries)Middle incomeMoldovaMongoliaMoroccoMozambiqueMyanmarNamibiaNepalNetherlandsNew ZealandNicaraguaNigerNigeriaNorth AmericaNorwayOECD membersOmanOther small statesPacific island small statesPakistanPanamaPapua New GuineaParaguayPeruPhilippinesPolandPortugalPost-demographic dividendPre-demographic dividendQatarRomaniaRussian FederationRwandaSamoaSao Tome and PrincipeSaudi ArabiaSenegalSeychellesSierra LeoneSingaporeSlovak RepublicSloveniaSmall statesSolomon IslandsSouth AfricaSouth AsiaSouth Asia (IDA & IBRD)SpainSri LankaSt. LuciaSt. Vincent and the GrenadinesSub-Saharan Africa Sub-Saharan Africa (excluding high income)Sub-Saharan Africa (IDA & IBRD countries)SudanSurinameSwazilandSwedenSwitzerlandSyrian Arab RepublicTajikistanTanzaniaThailandTogoTongaTrinidad and TobagoTunisiaTurkeyTurkmenistanUgandaUkraineUnited Arab EmiratesUnited KingdomUnited StatesUpper middle incomeUruguayUzbekistanVanuatuVenezuela, RBVietnamWorldYemen, Rep.ZambiaZimbabwe Timeline:
This timeline shows a graph from 1971 to 2015 of Senegal. No data until 1970. Number of actual observations by date: 45.
Source name:
World Development Indicators
Source organization:
World Bank staff estimates based on sources and methods in World Bank's "The Changing Wealth of Nations: Measuring Sustainable Development in the New Millennium" (2011).
Categories, topics:
Economy & Growth
Last updated:
apr 23, 2017
Indicators value changes by year
Minimum:
211.703
jan 1, 1971
Maximum:
973.983
jan 1, 2009
At the date of observation
Value
Absolute change
Change from previous value
jan 1, 1971
211.703
+211.703
0.0%
jan 1, 1972
211.951
+0.248
0.12%
jan 1, 1973
250.614
+38.664
18.24%
jan 1, 1974
273.013
+22.398
8.94%
jan 1, 1975
292.229
+19.216
7.04%
jan 1, 1976
385.773
+93.544
32.01%
jan 1, 1977
393.12
+7.347
1.9%
jan 1, 1978
392.672
-0.448
-0.11%
jan 1, 1979
421.581
+28.91
7.36%
jan 1, 1980
521.769
+100.187
23.76%
jan 1, 1981
545.082
+23.314
4.47%
jan 1, 1982
474.827
-70.256
-12.89%
jan 1, 1983
462.181
-12.646
-2.66%
jan 1, 1984
401.363
-60.818
-13.16%
jan 1, 1985
372.2
-29.163
-7.27%
jan 1, 1986
398.608
+26.408
7.09%
jan 1, 1987
552.515
+153.907
38.61%
jan 1, 1988
645.431
+92.916
16.82%
jan 1, 1989
616.798
-28.633
-4.44%
jan 1, 1990
586.747
-30.051
-4.87%
jan 1, 1991
667.473
+80.727
13.76%
jan 1, 1992
631.857
-35.616
-5.34%
jan 1, 1993
664.042
+32.185
5.09%
jan 1, 1994
596.327
-67.715
-10.2%
jan 1, 1995
391.004
-205.323
-34.43%
jan 1, 1996
486.875
+95.871
24.52%
jan 1, 1997
502.935
+16.06
3.3%
jan 1, 1998
445.792
-57.143
-11.36%
jan 1, 1999
469.196
+23.404
5.25%
jan 1, 2000
465.213
-3.983
-0.85%
jan 1, 2001
412.567
-52.646
-11.32%
jan 1, 2002
424.092
+11.525
2.79%
jan 1, 2003
449.411
+25.319
5.97%
jan 1, 2004
566.886
+117.475
26.14%
jan 1, 2005
648.403
+81.517
14.38%
jan 1, 2006
678.567
+30.163
4.65%
jan 1, 2007
714.033
+35.466
5.23%
jan 1, 2008
841.01
+126.977
17.78%
jan 1, 2009
973.983
+132.973
15.81%
jan 1, 2010
895.259
-78.724
-8.08%
jan 1, 2011
880.723
-14.536
-1.62%
jan 1, 2012
941.236
+60.513
6.87%
jan 1, 2013
881.705
-59.531
-6.32%
jan 1, 2014
904.752
+23.047
2.61%
jan 1, 2015
931.102
+26.351
2.91%
Ranking of countries by current statistics by years


Comments: