29
/
en
AIzaSyAYiBZKx7MnpbEhh9jyipgxe19OcubqV5w
April 1, 2024
189822
Mali
MLI
true
2
1
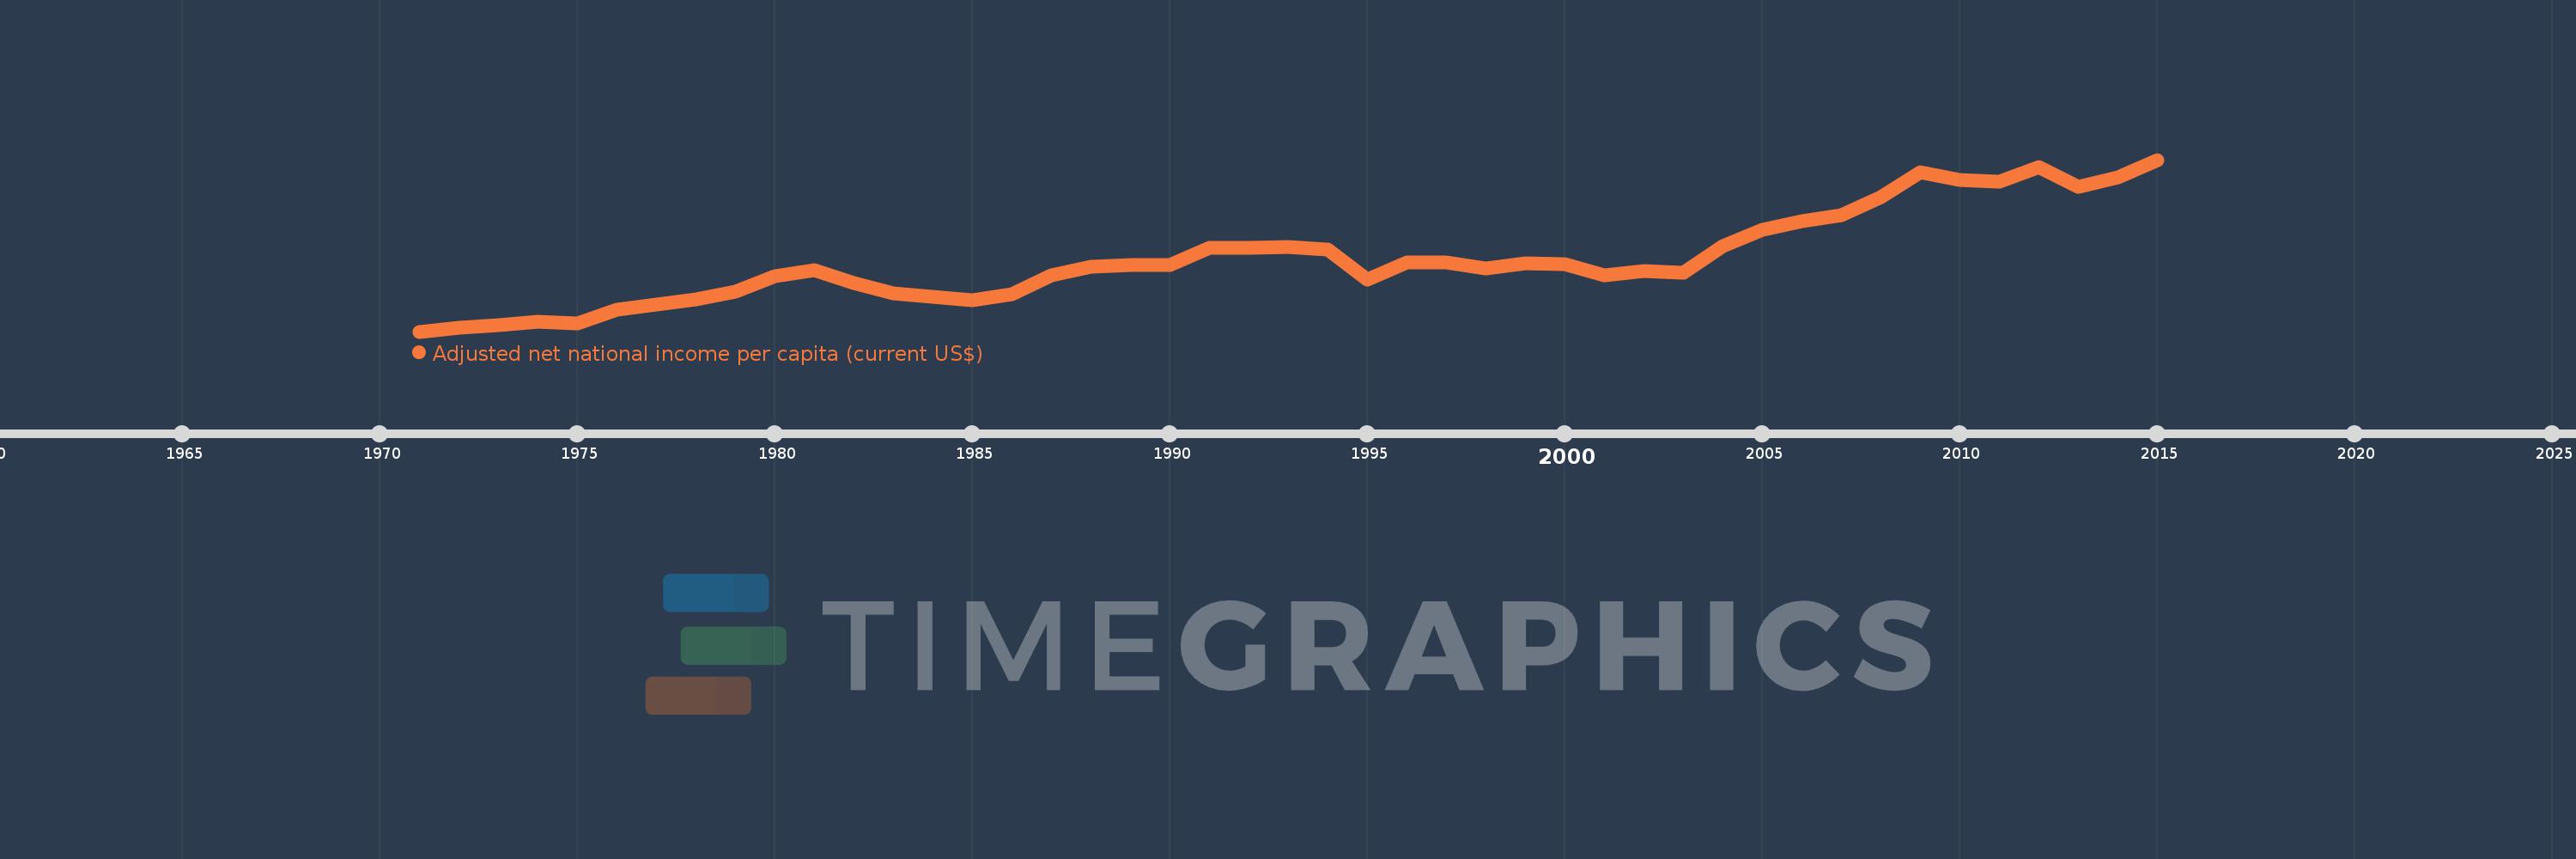
Adjusted net national income per capita (current US$)
2015,2014,2013,2012,2011,2010,2009,2008,2007,2006,2005,2004,2003,2002,2001,2000,1999,1998,1997,1996,1995,1994,1993,1992,1991,1990,1989,1988,1987,1986,1985,1984,1983,1982,1981,1980,1979,1978,1977,1976,1975,1974,1973,1972,1971
This statistics in other country:
AfghanistanAlbaniaAlgeriaAngolaArab WorldArgentinaArmeniaAustraliaAustriaAzerbaijanBahamas, TheBahrainBangladeshBarbadosBelarusBelgiumBelizeBeninBhutanBoliviaBotswanaBrazilBrunei DarussalamBulgariaBurkina FasoBurundiCabo VerdeCambodiaCameroonCanadaCaribbean small statesCentral African RepublicCentral Europe and the BalticsChadChileChinaColombiaComorosCongo, Dem. Rep.Congo, Rep.Costa RicaCote d'IvoireCroatiaCubaCyprusCzech RepublicDenmarkDjiboutiDominicaDominican RepublicEarly-demographic dividendEast Asia & PacificEast Asia & Pacific (excluding high income)East Asia & Pacific (IDA & IBRD countries)EcuadorEgypt, Arab Rep.El SalvadorEquatorial GuineaEritreaEstoniaEthiopiaEuro areaEurope & Central AsiaEurope & Central Asia (excluding high income)Europe & Central Asia (IDA & IBRD countries)European UnionFijiFinlandFragile and conflict affected situationsFranceGabonGambia, TheGeorgiaGermanyGhanaGreeceGuatemalaGuineaGuinea-BissauGuyanaHaitiHeavily indebted poor countries (HIPC)High incomeHondurasHong Kong SAR, ChinaHungaryIBRD onlyIcelandIDA & IBRD totalIDA blendIDA onlyIDA totalIndiaIndonesiaIran, Islamic Rep.IraqIrelandIsraelItalyJamaicaJapanJordanKazakhstanKenyaKiribatiKorea, Rep.KuwaitKyrgyz RepublicLao PDRLate-demographic dividendLatin America & Caribbean Latin America & Caribbean (excluding high income)Latin America & the Caribbean (IDA & IBRD countries)LatviaLeast developed countries: UN classificationLebanonLesothoLiberiaLibyaLithuaniaLow & middle incomeLow incomeLower middle incomeLuxembourgMacedonia, FYRMadagascarMalawiMalaysiaMaldivesMaliMauritaniaMauritiusMexicoMiddle East & North AfricaMiddle East & North Africa (excluding high income)Middle East & North Africa (IDA & IBRD countries)Middle incomeMoldovaMongoliaMoroccoMozambiqueMyanmarNamibiaNepalNetherlandsNew ZealandNicaraguaNigerNigeriaNorth AmericaNorwayOECD membersOmanOther small statesPacific island small statesPakistanPanamaPapua New GuineaParaguayPeruPhilippinesPolandPortugalPost-demographic dividendPre-demographic dividendQatarRomaniaRussian FederationRwandaSamoaSao Tome and PrincipeSaudi ArabiaSenegalSeychellesSierra LeoneSingaporeSlovak RepublicSloveniaSmall statesSolomon IslandsSouth AfricaSouth AsiaSouth Asia (IDA & IBRD)SpainSri LankaSt. LuciaSt. Vincent and the GrenadinesSub-Saharan Africa Sub-Saharan Africa (excluding high income)Sub-Saharan Africa (IDA & IBRD countries)SudanSurinameSwazilandSwedenSwitzerlandSyrian Arab RepublicTajikistanTanzaniaThailandTogoTongaTrinidad and TobagoTunisiaTurkeyTurkmenistanUgandaUkraineUnited Arab EmiratesUnited KingdomUnited StatesUpper middle incomeUruguayUzbekistanVanuatuVenezuela, RBVietnamWorldYemen, Rep.ZambiaZimbabwe Timeline:
This timeline shows a graph from 1971 to 2015 of Mali. No data until 1970. Number of actual observations by date: 45.
Source name:
World Development Indicators
Source organization:
World Bank staff estimates based on sources and methods in World Bank's "The Changing Wealth of Nations: Measuring Sustainable Development in the New Millennium" (2011).
Categories, topics:
Economy & Growth
Last updated:
apr 23, 2017
Indicators value changes by year
Minimum:
57.751
jan 1, 1971
Maximum:
556.044
jan 1, 2015
At the date of observation
Value
Absolute change
Change from previous value
jan 1, 1971
57.751
+57.751
0.0%
jan 1, 1972
68.865
+11.114
19.24%
jan 1, 1973
76.998
+8.133
11.81%
jan 1, 1974
86.98
+9.982
12.96%
jan 1, 1975
80.755
-6.225
-7.16%
jan 1, 1976
122.299
+41.544
51.44%
jan 1, 1977
136.996
+14.697
12.02%
jan 1, 1978
151.974
+14.978
10.93%
jan 1, 1979
174.497
+22.523
14.82%
jan 1, 1980
219.683
+45.186
25.89%
jan 1, 1981
234.706
+15.023
6.84%
jan 1, 1982
199.107
-35.599
-15.17%
jan 1, 1983
169.026
-30.082
-15.11%
jan 1, 1984
159.498
-9.527
-5.64%
jan 1, 1985
149.407
-10.091
-6.33%
jan 1, 1986
166.659
+17.252
11.55%
jan 1, 1987
221.95
+55.291
33.18%
jan 1, 1988
246.73
+24.78
11.16%
jan 1, 1989
251.241
+4.511
1.83%
jan 1, 1990
251.811
+0.571
0.23%
jan 1, 1991
301.15
+49.339
19.59%
jan 1, 1992
299.85
-1.3
-0.43%
jan 1, 1993
304.385
+4.535
1.51%
jan 1, 1994
296.747
-7.637
-2.51%
jan 1, 1995
207.286
-89.462
-30.15%
jan 1, 1996
259.462
+52.177
25.17%
jan 1, 1997
258.322
-1.141
-0.44%
jan 1, 1998
241.212
-17.11
-6.62%
jan 1, 1999
255.749
+14.537
6.03%
jan 1, 2000
253.487
-2.262
-0.88%
jan 1, 2001
221.163
-32.323
-12.75%
jan 1, 2002
234.566
+13.403
6.06%
jan 1, 2003
227.203
-7.363
-3.14%
jan 1, 2004
305.703
+78.5
34.55%
jan 1, 2005
352.338
+46.635
15.25%
jan 1, 2006
376.831
+24.493
6.95%
jan 1, 2007
396.59
+19.76
5.24%
jan 1, 2008
447.205
+50.615
12.76%
jan 1, 2009
518.69
+71.485
15.98%
jan 1, 2010
496.462
-22.228
-4.29%
jan 1, 2011
493.162
-3.3
-0.66%
jan 1, 2012
533.714
+40.551
8.22%
jan 1, 2013
477.068
-56.646
-10.61%
jan 1, 2014
505.041
+27.973
5.86%
jan 1, 2015
556.044
+51.002
10.1%
Ranking of countries by current statistics by years


Comments: