29
/
en
AIzaSyAYiBZKx7MnpbEhh9jyipgxe19OcubqV5w
April 1, 2024
238894
Sierra Leone
SLE
true
2
1
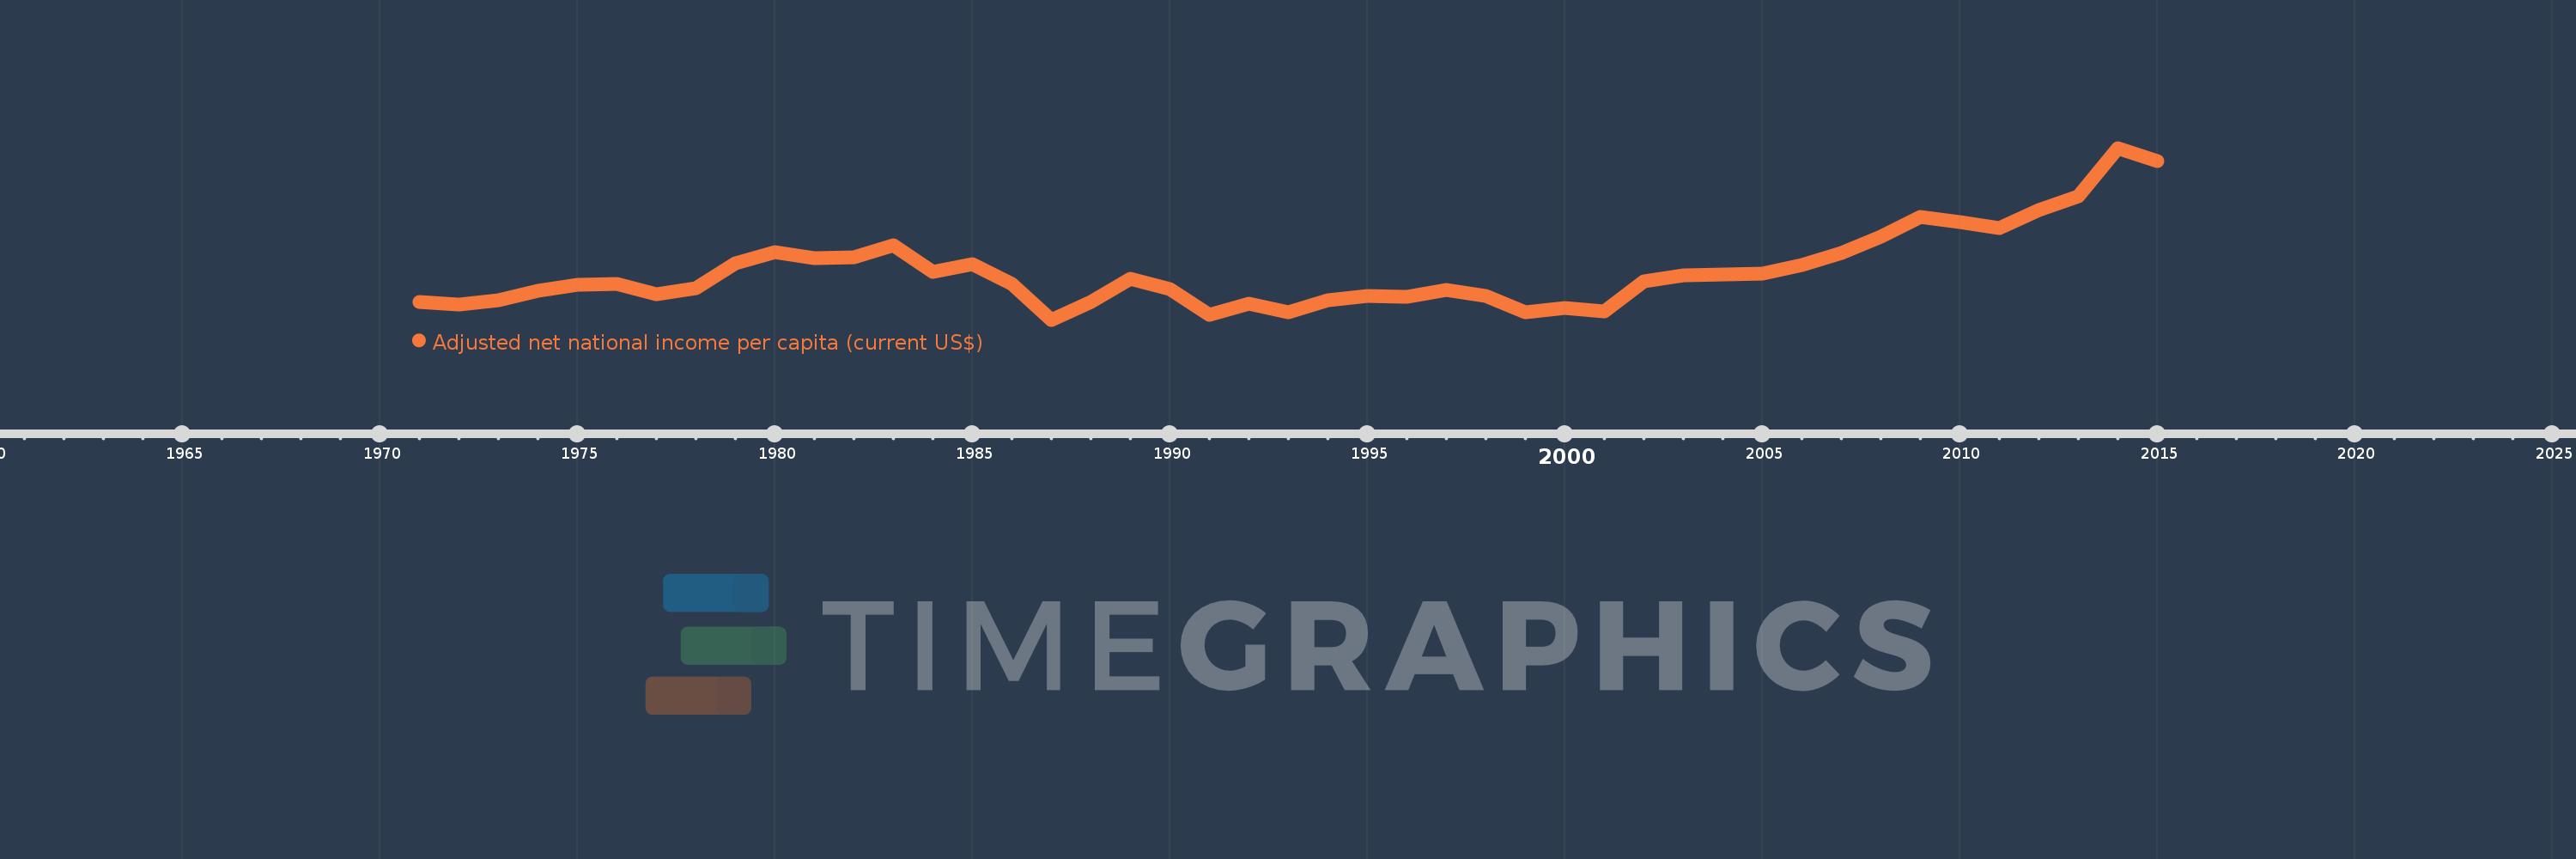
Adjusted net national income per capita (current US$)
2015,2014,2013,2012,2011,2010,2009,2008,2007,2006,2005,2004,2003,2002,2001,2000,1999,1998,1997,1996,1995,1994,1993,1992,1991,1990,1989,1988,1987,1986,1985,1984,1983,1982,1981,1980,1979,1978,1977,1976,1975,1974,1973,1972,1971
This statistics in other country:
AfghanistanAlbaniaAlgeriaAngolaArab WorldArgentinaArmeniaAustraliaAustriaAzerbaijanBahamas, TheBahrainBangladeshBarbadosBelarusBelgiumBelizeBeninBhutanBoliviaBotswanaBrazilBrunei DarussalamBulgariaBurkina FasoBurundiCabo VerdeCambodiaCameroonCanadaCaribbean small statesCentral African RepublicCentral Europe and the BalticsChadChileChinaColombiaComorosCongo, Dem. Rep.Congo, Rep.Costa RicaCote d'IvoireCroatiaCubaCyprusCzech RepublicDenmarkDjiboutiDominicaDominican RepublicEarly-demographic dividendEast Asia & PacificEast Asia & Pacific (excluding high income)East Asia & Pacific (IDA & IBRD countries)EcuadorEgypt, Arab Rep.El SalvadorEquatorial GuineaEritreaEstoniaEthiopiaEuro areaEurope & Central AsiaEurope & Central Asia (excluding high income)Europe & Central Asia (IDA & IBRD countries)European UnionFijiFinlandFragile and conflict affected situationsFranceGabonGambia, TheGeorgiaGermanyGhanaGreeceGuatemalaGuineaGuinea-BissauGuyanaHaitiHeavily indebted poor countries (HIPC)High incomeHondurasHong Kong SAR, ChinaHungaryIBRD onlyIcelandIDA & IBRD totalIDA blendIDA onlyIDA totalIndiaIndonesiaIran, Islamic Rep.IraqIrelandIsraelItalyJamaicaJapanJordanKazakhstanKenyaKiribatiKorea, Rep.KuwaitKyrgyz RepublicLao PDRLate-demographic dividendLatin America & Caribbean Latin America & Caribbean (excluding high income)Latin America & the Caribbean (IDA & IBRD countries)LatviaLeast developed countries: UN classificationLebanonLesothoLiberiaLibyaLithuaniaLow & middle incomeLow incomeLower middle incomeLuxembourgMacedonia, FYRMadagascarMalawiMalaysiaMaldivesMaliMauritaniaMauritiusMexicoMiddle East & North AfricaMiddle East & North Africa (excluding high income)Middle East & North Africa (IDA & IBRD countries)Middle incomeMoldovaMongoliaMoroccoMozambiqueMyanmarNamibiaNepalNetherlandsNew ZealandNicaraguaNigerNigeriaNorth AmericaNorwayOECD membersOmanOther small statesPacific island small statesPakistanPanamaPapua New GuineaParaguayPeruPhilippinesPolandPortugalPost-demographic dividendPre-demographic dividendQatarRomaniaRussian FederationRwandaSamoaSao Tome and PrincipeSaudi ArabiaSenegalSeychellesSierra LeoneSingaporeSlovak RepublicSloveniaSmall statesSolomon IslandsSouth AfricaSouth AsiaSouth Asia (IDA & IBRD)SpainSri LankaSt. LuciaSt. Vincent and the GrenadinesSub-Saharan Africa Sub-Saharan Africa (excluding high income)Sub-Saharan Africa (IDA & IBRD countries)SudanSurinameSwazilandSwedenSwitzerlandSyrian Arab RepublicTajikistanTanzaniaThailandTogoTongaTrinidad and TobagoTunisiaTurkeyTurkmenistanUgandaUkraineUnited Arab EmiratesUnited KingdomUnited StatesUpper middle incomeUruguayUzbekistanVanuatuVenezuela, RBVietnamWorldYemen, Rep.ZambiaZimbabwe Timeline:
This timeline shows a graph from 1971 to 2015 of Sierra Leone. No data until 1970. Number of actual observations by date: 45.
Source name:
World Development Indicators
Source organization:
World Bank staff estimates based on sources and methods in World Bank's "The Changing Wealth of Nations: Measuring Sustainable Development in the New Millennium" (2011).
Categories, topics:
Economy & Growth
Last updated:
apr 23, 2017
Indicators value changes by year
Minimum:
93.118
jan 1, 1987
Maximum:
621.31
jan 1, 2014
At the date of observation
Value
Absolute change
Change from previous value
jan 1, 1971
146.7
+146.7
0.0%
jan 1, 1972
139.584
-7.116
-4.85%
jan 1, 1973
152.92
+13.336
9.55%
jan 1, 1974
182.34
+29.42
19.24%
jan 1, 1975
200.768
+18.428
10.11%
jan 1, 1976
202.364
+1.596
0.8%
jan 1, 1977
172.358
-30.006
-14.83%
jan 1, 1978
189.216
+16.858
9.78%
jan 1, 1979
265.368
+76.152
40.25%
jan 1, 1980
301.865
+36.497
13.75%
jan 1, 1981
281.825
-20.04
-6.64%
jan 1, 1982
285.633
+3.808
1.35%
jan 1, 1983
321.346
+35.713
12.5%
jan 1, 1984
241.01
-80.336
-25.0%
jan 1, 1985
264.551
+23.541
9.77%
jan 1, 1986
203.244
-61.307
-23.17%
jan 1, 1987
93.118
-110.126
-54.18%
jan 1, 1988
146.514
+53.396
57.34%
jan 1, 1989
218.823
+72.31
49.35%
jan 1, 1990
186.688
-32.135
-14.69%
jan 1, 1991
108.982
-77.706
-41.62%
jan 1, 1992
142.37
+33.388
30.64%
jan 1, 1993
115.89
-26.479
-18.6%
jan 1, 1994
152.855
+36.965
31.9%
jan 1, 1995
166.892
+14.037
9.18%
jan 1, 1996
163.326
-3.566
-2.14%
jan 1, 1997
186.072
+22.746
13.93%
jan 1, 1998
167.484
-18.588
-9.99%
jan 1, 1999
116.736
-50.748
-30.3%
jan 1, 2000
129.999
+13.263
11.36%
jan 1, 2001
119.579
-10.42
-8.02%
jan 1, 2002
211.477
+91.898
76.85%
jan 1, 2003
230.925
+19.448
9.2%
jan 1, 2004
231.854
+0.929
0.4%
jan 1, 2005
235.047
+3.193
1.38%
jan 1, 2006
261.073
+26.025
11.07%
jan 1, 2007
297.546
+36.473
13.97%
jan 1, 2008
348.885
+51.339
17.25%
jan 1, 2009
408.873
+59.988
17.19%
jan 1, 2010
392.222
-16.651
-4.07%
jan 1, 2011
376.12
-16.102
-4.11%
jan 1, 2012
431.459
+55.338
14.71%
jan 1, 2013
471.75
+40.291
9.34%
jan 1, 2014
621.31
+149.56
31.7%
jan 1, 2015
581.653
-39.657
-6.38%
Ranking of countries by current statistics by years


Comments: