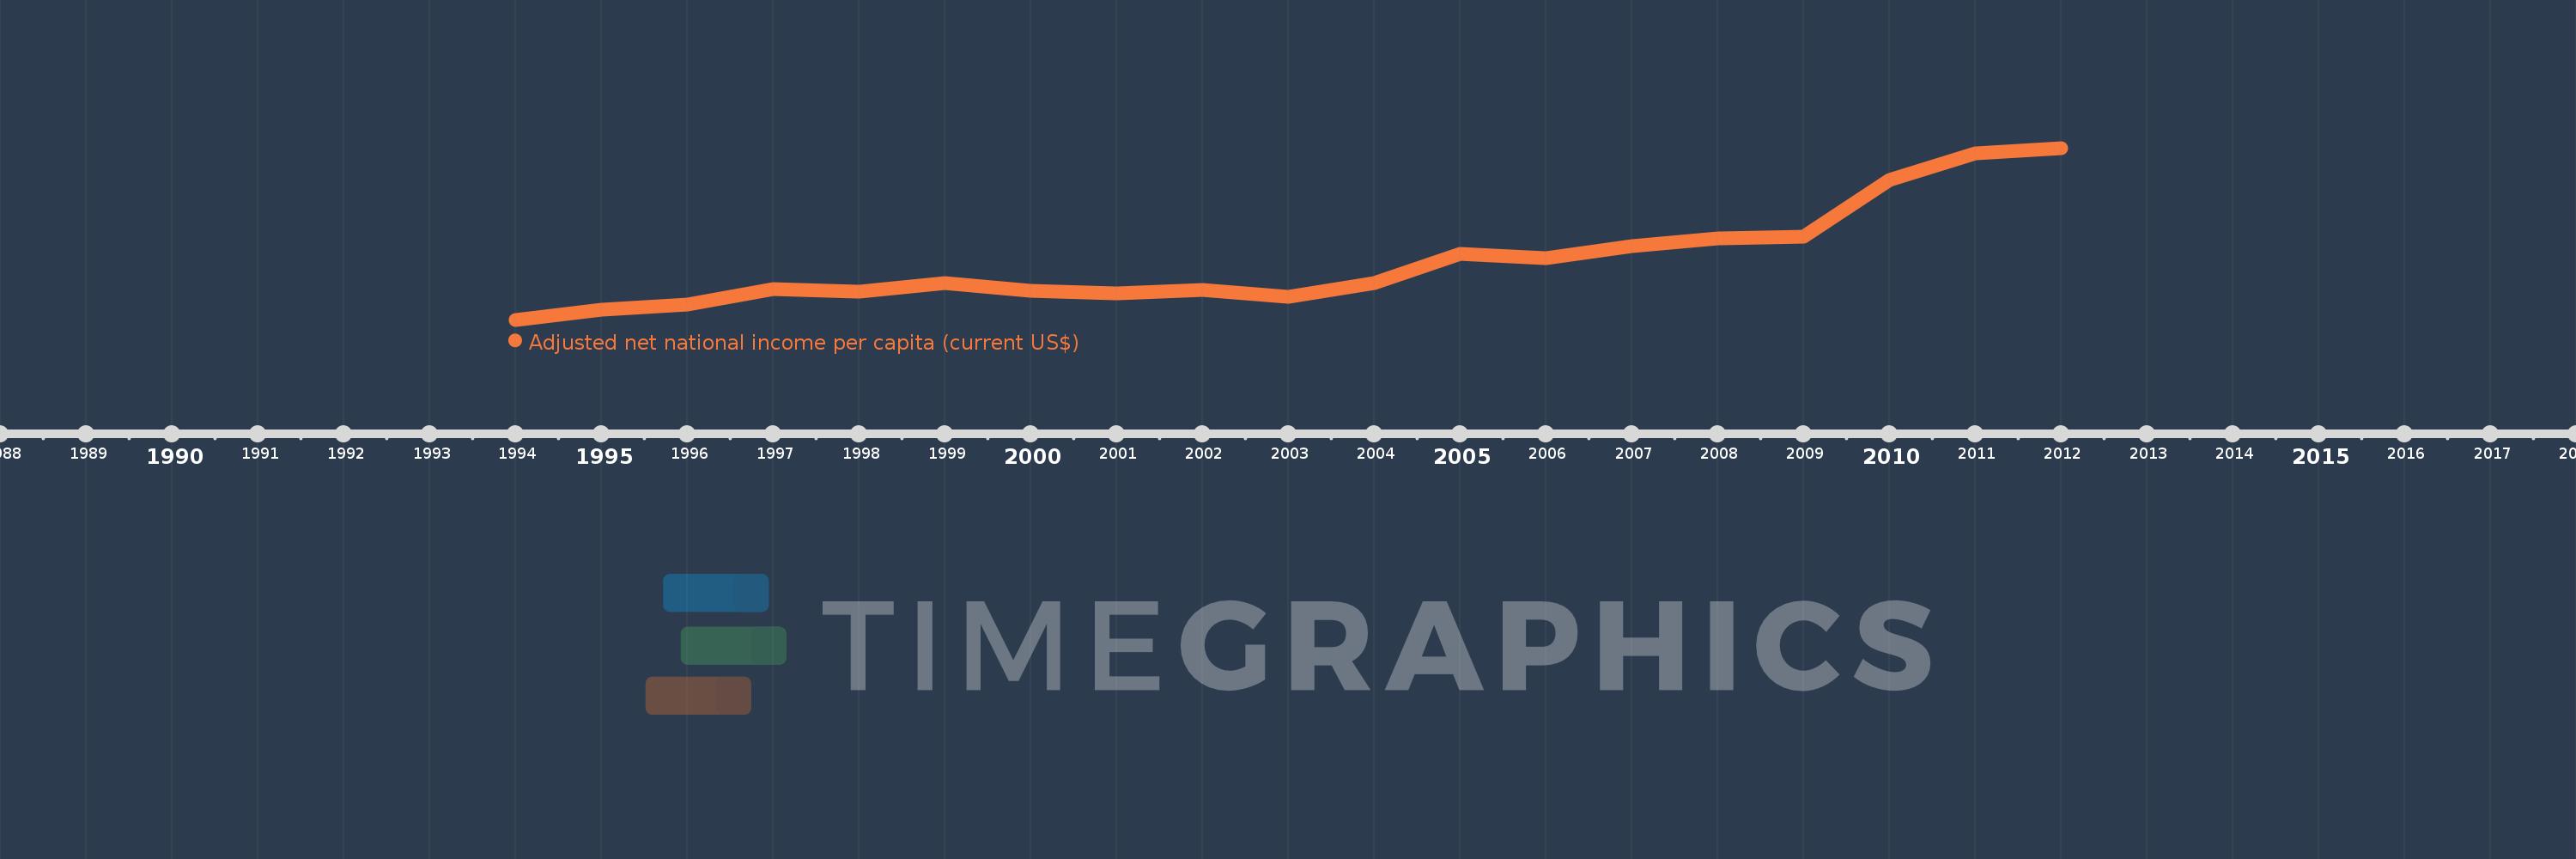
This timeline shows a graph from 1994 to 2012 of Eritrea. No data until 1993. Number of actual observations by date: 19.
Source name:
World Development Indicators
Source organization:
World Bank staff estimates based on sources and methods in World Bank's "The Changing Wealth of Nations: Measuring Sustainable Development in the New Millennium" (2011).
Categories, topics:
Economy & Growth
Last updated:
apr 23, 2017
Indicators value changes by year
Meaning:
221.606
Minimum:
127.789
jan 1, 1994
Maximum:
404.232
jan 1, 2012
At the date of observation
Value
Absolute change
Change from the previous value
jan 1, 1994
127.789
+127.789
0.0%
jan 1, 1995
143.791
+16.002
12.52%
jan 1, 1996
151.959
+8.169
5.68%
jan 1, 1997
176.566
+24.607
16.19%
jan 1, 1998
172.407
-4.159
-2.36%
jan 1, 1999
186.779
+14.372
8.34%
jan 1, 2000
173.829
-12.95
-6.93%
jan 1, 2001
170.544
-3.286
-1.89%
jan 1, 2002
175.732
+5.189
3.04%
jan 1, 2003
165.23
-10.503
-5.98%
jan 1, 2004
187.266
+22.036
13.34%
jan 1, 2005
233.171
+45.905
24.51%
jan 1, 2006
227.049
-6.122
-2.63%
jan 1, 2007
246.1
+19.051
8.39%
jan 1, 2008
258.656
+12.556
5.1%
jan 1, 2009
261.645
+2.989
1.16%
jan 1, 2010
352.656
+91.011
34.78%
jan 1, 2011
395.11
+42.455
12.04%
jan 1, 2012
404.232
+9.121
2.31%
Ranking of countries by current statistics by years
