29
/
en
AIzaSyAYiBZKx7MnpbEhh9jyipgxe19OcubqV5w
April 1, 2024
211291
Niger
NER
true
2
1
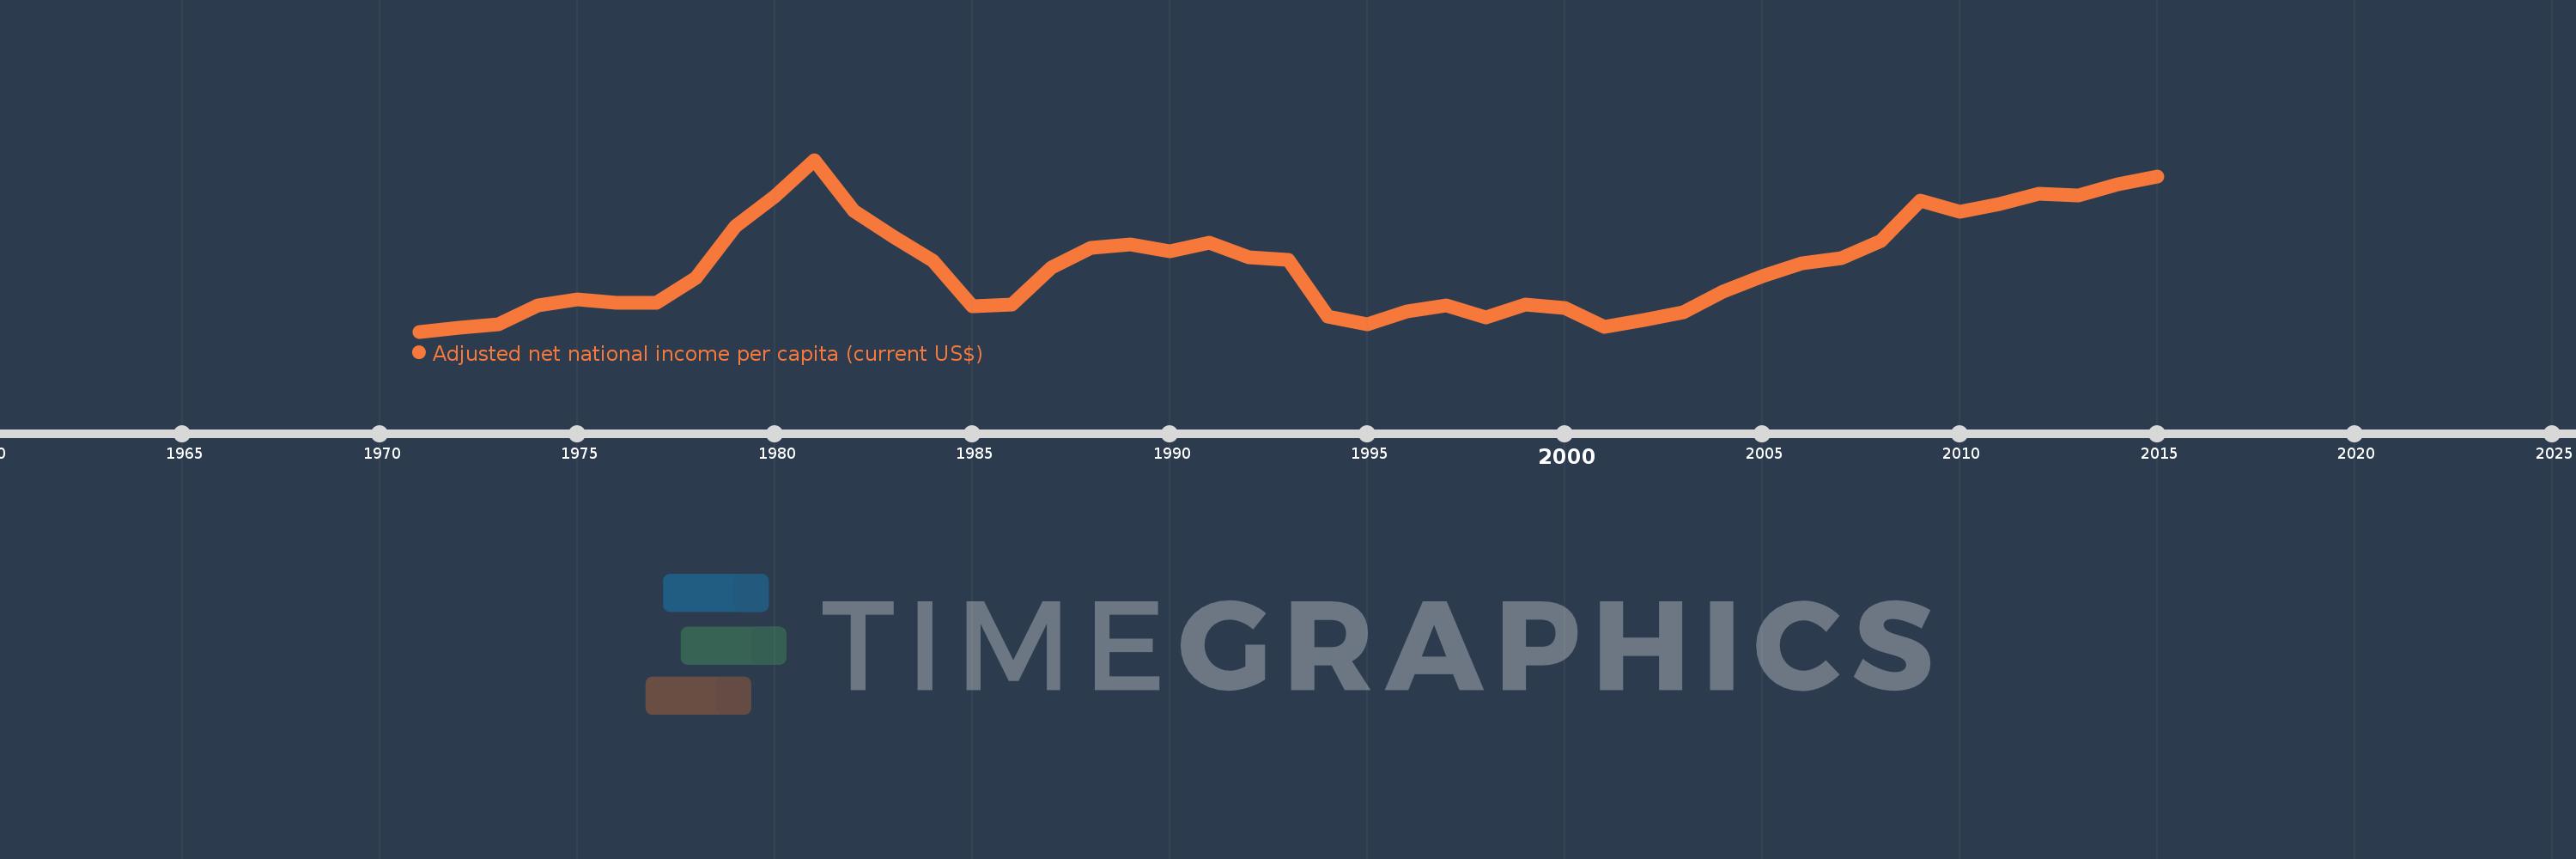
Adjusted net national income per capita (current US$)
2015,2014,2013,2012,2011,2010,2009,2008,2007,2006,2005,2004,2003,2002,2001,2000,1999,1998,1997,1996,1995,1994,1993,1992,1991,1990,1989,1988,1987,1986,1985,1984,1983,1982,1981,1980,1979,1978,1977,1976,1975,1974,1973,1972,1971
This statistics in other country:
AfghanistanAlbaniaAlgeriaAngolaArab WorldArgentinaArmeniaAustraliaAustriaAzerbaijanBahamas, TheBahrainBangladeshBarbadosBelarusBelgiumBelizeBeninBhutanBoliviaBotswanaBrazilBrunei DarussalamBulgariaBurkina FasoBurundiCabo VerdeCambodiaCameroonCanadaCaribbean small statesCentral African RepublicCentral Europe and the BalticsChadChileChinaColombiaComorosCongo, Dem. Rep.Congo, Rep.Costa RicaCote d'IvoireCroatiaCubaCyprusCzech RepublicDenmarkDjiboutiDominicaDominican RepublicEarly-demographic dividendEast Asia & PacificEast Asia & Pacific (excluding high income)East Asia & Pacific (IDA & IBRD countries)EcuadorEgypt, Arab Rep.El SalvadorEquatorial GuineaEritreaEstoniaEthiopiaEuro areaEurope & Central AsiaEurope & Central Asia (excluding high income)Europe & Central Asia (IDA & IBRD countries)European UnionFijiFinlandFragile and conflict affected situationsFranceGabonGambia, TheGeorgiaGermanyGhanaGreeceGuatemalaGuineaGuinea-BissauGuyanaHaitiHeavily indebted poor countries (HIPC)High incomeHondurasHong Kong SAR, ChinaHungaryIBRD onlyIcelandIDA & IBRD totalIDA blendIDA onlyIDA totalIndiaIndonesiaIran, Islamic Rep.IraqIrelandIsraelItalyJamaicaJapanJordanKazakhstanKenyaKiribatiKorea, Rep.KuwaitKyrgyz RepublicLao PDRLate-demographic dividendLatin America & Caribbean Latin America & Caribbean (excluding high income)Latin America & the Caribbean (IDA & IBRD countries)LatviaLeast developed countries: UN classificationLebanonLesothoLiberiaLibyaLithuaniaLow & middle incomeLow incomeLower middle incomeLuxembourgMacedonia, FYRMadagascarMalawiMalaysiaMaldivesMaliMauritaniaMauritiusMexicoMiddle East & North AfricaMiddle East & North Africa (excluding high income)Middle East & North Africa (IDA & IBRD countries)Middle incomeMoldovaMongoliaMoroccoMozambiqueMyanmarNamibiaNepalNetherlandsNew ZealandNicaraguaNigerNigeriaNorth AmericaNorwayOECD membersOmanOther small statesPacific island small statesPakistanPanamaPapua New GuineaParaguayPeruPhilippinesPolandPortugalPost-demographic dividendPre-demographic dividendQatarRomaniaRussian FederationRwandaSamoaSao Tome and PrincipeSaudi ArabiaSenegalSeychellesSierra LeoneSingaporeSlovak RepublicSloveniaSmall statesSolomon IslandsSouth AfricaSouth AsiaSouth Asia (IDA & IBRD)SpainSri LankaSt. LuciaSt. Vincent and the GrenadinesSub-Saharan Africa Sub-Saharan Africa (excluding high income)Sub-Saharan Africa (IDA & IBRD countries)SudanSurinameSwazilandSwedenSwitzerlandSyrian Arab RepublicTajikistanTanzaniaThailandTogoTongaTrinidad and TobagoTunisiaTurkeyTurkmenistanUgandaUkraineUnited Arab EmiratesUnited KingdomUnited StatesUpper middle incomeUruguayUzbekistanVanuatuVenezuela, RBVietnamWorldYemen, Rep.ZambiaZimbabwe Timeline:
This timeline shows a graph from 1971 to 2015 of Niger. No data until 1970. Number of actual observations by date: 45.
Source name:
World Development Indicators
Source organization:
World Bank staff estimates based on sources and methods in World Bank's "The Changing Wealth of Nations: Measuring Sustainable Development in the New Millennium" (2011).
Categories, topics:
Economy & Growth
Last updated:
apr 23, 2017
Indicators value changes by year
Minimum:
129.335
jan 1, 1971
Maximum:
368.336
jan 1, 1981
At the date of observation
Value
Absolute change
Change from previous value
jan 1, 1971
129.335
+129.335
0.0%
jan 1, 1972
134.99
+5.655
4.37%
jan 1, 1973
139.503
+4.513
3.34%
jan 1, 1974
165.404
+25.901
18.57%
jan 1, 1975
174.496
+9.093
5.5%
jan 1, 1976
168.963
-5.533
-3.17%
jan 1, 1977
168.847
-0.116
-0.07%
jan 1, 1978
203.542
+34.694
20.55%
jan 1, 1979
275.406
+71.865
35.31%
jan 1, 1980
317.834
+42.428
15.41%
jan 1, 1981
368.336
+50.502
15.89%
jan 1, 1982
297.823
-70.513
-19.14%
jan 1, 1983
260.859
-36.964
-12.41%
jan 1, 1984
228.206
-32.654
-12.52%
jan 1, 1985
165.003
-63.203
-27.7%
jan 1, 1986
166.672
+1.669
1.01%
jan 1, 1987
218.929
+52.257
31.35%
jan 1, 1988
245.52
+26.591
12.15%
jan 1, 1989
250.453
+4.933
2.01%
jan 1, 1990
241.153
-9.3
-3.71%
jan 1, 1991
253.578
+12.425
5.15%
jan 1, 1992
232.489
-21.089
-8.32%
jan 1, 1993
228.581
-3.908
-1.68%
jan 1, 1994
150.636
-77.945
-34.1%
jan 1, 1995
139.535
-11.101
-7.37%
jan 1, 1996
157.689
+18.154
13.01%
jan 1, 1997
166.319
+8.63
5.47%
jan 1, 1998
148.889
-17.43
-10.48%
jan 1, 1999
167.319
+18.43
12.38%
jan 1, 2000
162.762
-4.557
-2.72%
jan 1, 2001
136.47
-26.292
-16.15%
jan 1, 2002
145.895
+9.425
6.91%
jan 1, 2003
155.656
+9.762
6.69%
jan 1, 2004
184.632
+28.976
18.62%
jan 1, 2005
206.384
+21.751
11.78%
jan 1, 2006
224.897
+18.514
8.97%
jan 1, 2007
231.374
+6.477
2.88%
jan 1, 2008
255.815
+24.441
10.56%
jan 1, 2009
311.013
+55.198
21.58%
jan 1, 2010
296.362
-14.651
-4.71%
jan 1, 2011
307.014
+10.652
3.59%
jan 1, 2012
321.084
+14.07
4.58%
jan 1, 2013
318.496
-2.588
-0.81%
jan 1, 2014
334.426
+15.93
5.0%
jan 1, 2015
344.504
+10.078
3.01%
Ranking of countries by current statistics by years


Comments: