29
/
en
AIzaSyAYiBZKx7MnpbEhh9jyipgxe19OcubqV5w
April 1, 2024
201173
Morocco
MAR
true
2
1
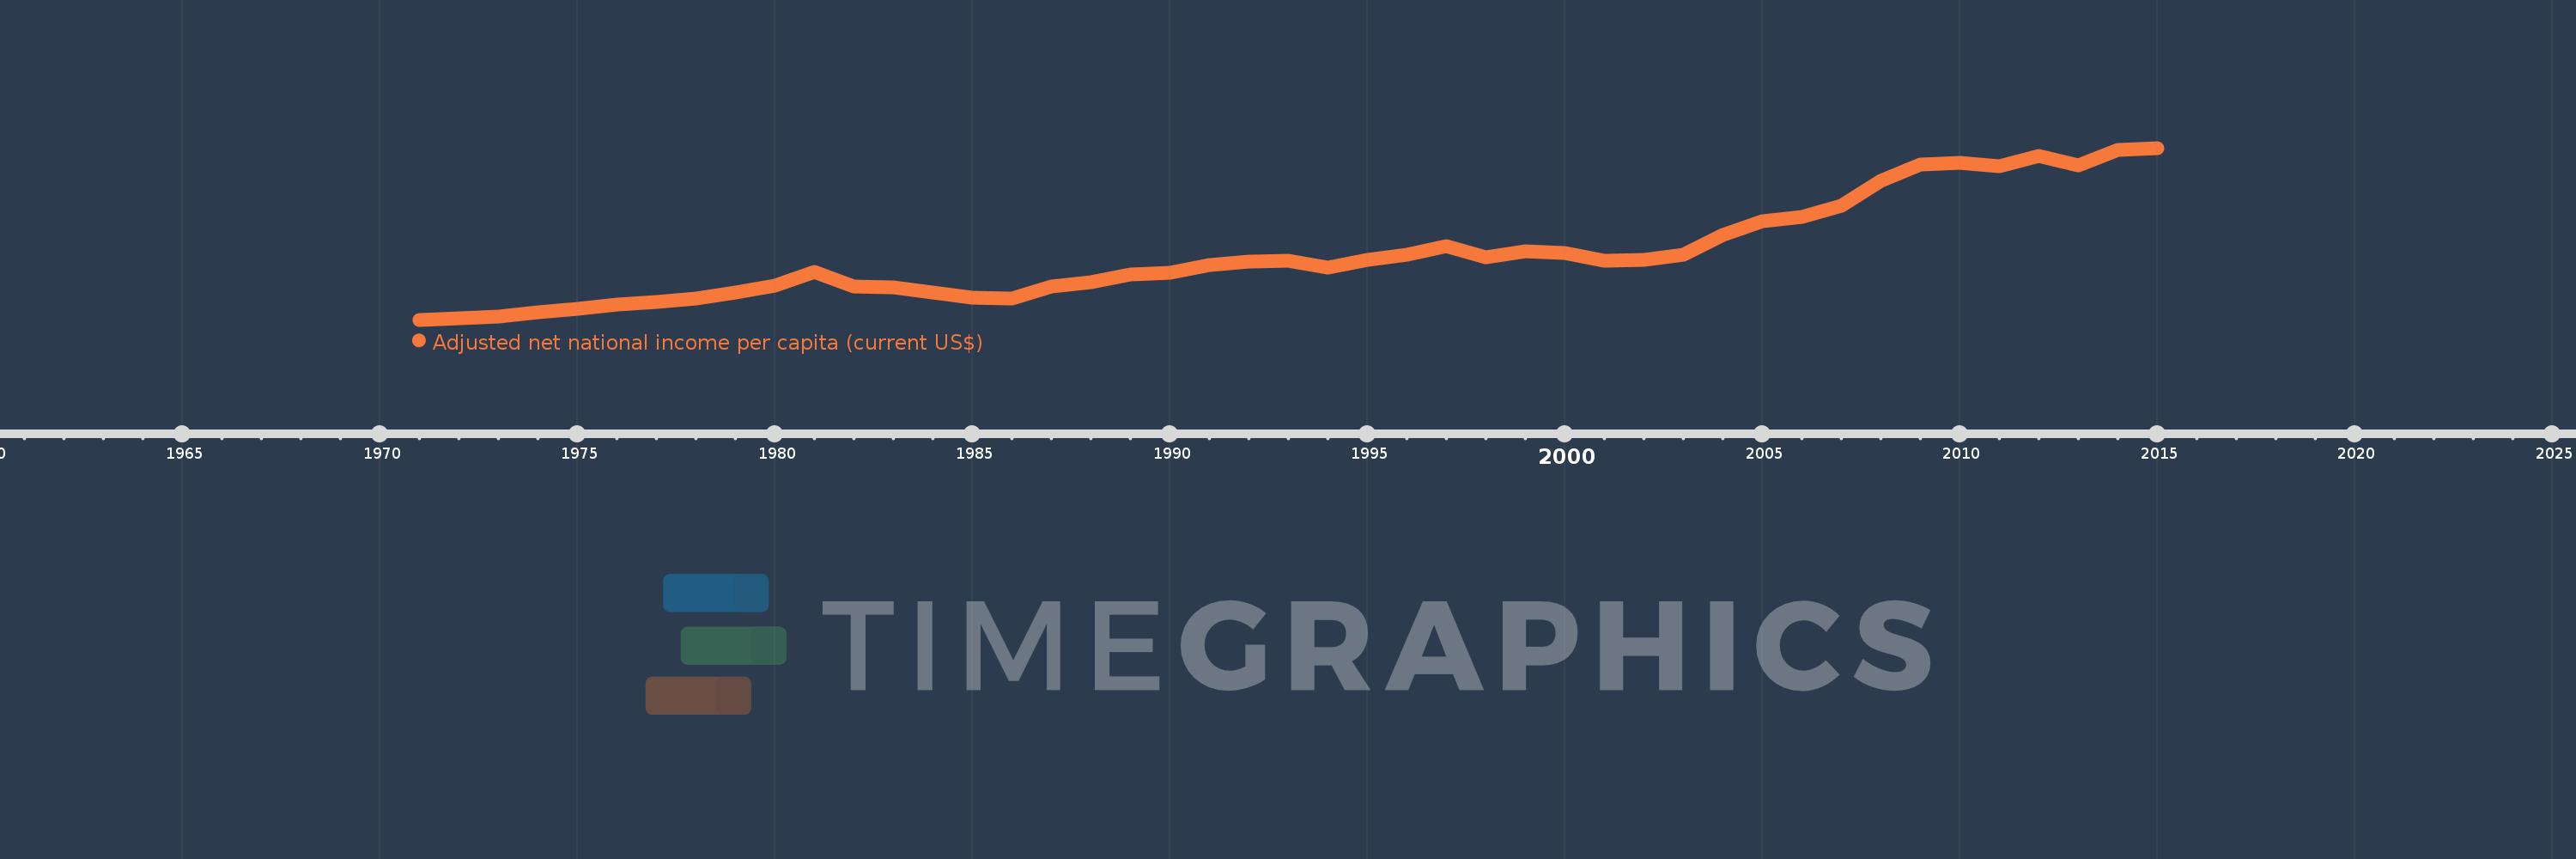
Adjusted net national income per capita (current US$)
2015,2014,2013,2012,2011,2010,2009,2008,2007,2006,2005,2004,2003,2002,2001,2000,1999,1998,1997,1996,1995,1994,1993,1992,1991,1990,1989,1988,1987,1986,1985,1984,1983,1982,1981,1980,1979,1978,1977,1976,1975,1974,1973,1972,1971
This statistics in other country:
AfghanistanAlbaniaAlgeriaAngolaArab WorldArgentinaArmeniaAustraliaAustriaAzerbaijanBahamas, TheBahrainBangladeshBarbadosBelarusBelgiumBelizeBeninBhutanBoliviaBotswanaBrazilBrunei DarussalamBulgariaBurkina FasoBurundiCabo VerdeCambodiaCameroonCanadaCaribbean small statesCentral African RepublicCentral Europe and the BalticsChadChileChinaColombiaComorosCongo, Dem. Rep.Congo, Rep.Costa RicaCote d'IvoireCroatiaCubaCyprusCzech RepublicDenmarkDjiboutiDominicaDominican RepublicEarly-demographic dividendEast Asia & PacificEast Asia & Pacific (excluding high income)East Asia & Pacific (IDA & IBRD countries)EcuadorEgypt, Arab Rep.El SalvadorEquatorial GuineaEritreaEstoniaEthiopiaEuro areaEurope & Central AsiaEurope & Central Asia (excluding high income)Europe & Central Asia (IDA & IBRD countries)European UnionFijiFinlandFragile and conflict affected situationsFranceGabonGambia, TheGeorgiaGermanyGhanaGreeceGuatemalaGuineaGuinea-BissauGuyanaHaitiHeavily indebted poor countries (HIPC)High incomeHondurasHong Kong SAR, ChinaHungaryIBRD onlyIcelandIDA & IBRD totalIDA blendIDA onlyIDA totalIndiaIndonesiaIran, Islamic Rep.IraqIrelandIsraelItalyJamaicaJapanJordanKazakhstanKenyaKiribatiKorea, Rep.KuwaitKyrgyz RepublicLao PDRLate-demographic dividendLatin America & Caribbean Latin America & Caribbean (excluding high income)Latin America & the Caribbean (IDA & IBRD countries)LatviaLeast developed countries: UN classificationLebanonLesothoLiberiaLibyaLithuaniaLow & middle incomeLow incomeLower middle incomeLuxembourgMacedonia, FYRMadagascarMalawiMalaysiaMaldivesMaliMauritaniaMauritiusMexicoMiddle East & North AfricaMiddle East & North Africa (excluding high income)Middle East & North Africa (IDA & IBRD countries)Middle incomeMoldovaMongoliaMoroccoMozambiqueMyanmarNamibiaNepalNetherlandsNew ZealandNicaraguaNigerNigeriaNorth AmericaNorwayOECD membersOmanOther small statesPacific island small statesPakistanPanamaPapua New GuineaParaguayPeruPhilippinesPolandPortugalPost-demographic dividendPre-demographic dividendQatarRomaniaRussian FederationRwandaSamoaSao Tome and PrincipeSaudi ArabiaSenegalSeychellesSierra LeoneSingaporeSlovak RepublicSloveniaSmall statesSolomon IslandsSouth AfricaSouth AsiaSouth Asia (IDA & IBRD)SpainSri LankaSt. LuciaSt. Vincent and the GrenadinesSub-Saharan Africa Sub-Saharan Africa (excluding high income)Sub-Saharan Africa (IDA & IBRD countries)SudanSurinameSwazilandSwedenSwitzerlandSyrian Arab RepublicTajikistanTanzaniaThailandTogoTongaTrinidad and TobagoTunisiaTurkeyTurkmenistanUgandaUkraineUnited Arab EmiratesUnited KingdomUnited StatesUpper middle incomeUruguayUzbekistanVanuatuVenezuela, RBVietnamWorldYemen, Rep.ZambiaZimbabwe Timeline:
This timeline shows a graph from 1971 to 2015 of Morocco. No data until 1970. Number of actual observations by date: 45.
Source name:
World Development Indicators
Source organization:
World Bank staff estimates based on sources and methods in World Bank's "The Changing Wealth of Nations: Measuring Sustainable Development in the New Millennium" (2011).
Categories, topics:
Economy & Growth
Last updated:
apr 23, 2017
Indicators value changes by year
Minimum:
228.068
jan 1, 1971
Maximum:
2.666K
jan 1, 2015
At the date of observation
Value
Absolute change
Change from previous value
jan 1, 1971
228.068
+228.068
0.0%
jan 1, 1972
244.076
+16.008
7.02%
jan 1, 1973
277.275
+33.2
13.6%
jan 1, 1974
332.321
+55.045
19.85%
jan 1, 1975
382.321
+50.0
15.05%
jan 1, 1976
448.215
+65.894
17.24%
jan 1, 1977
475.006
+26.791
5.98%
jan 1, 1978
532.465
+57.459
12.1%
jan 1, 1979
611.905
+79.44
14.92%
jan 1, 1980
712.118
+100.212
16.38%
jan 1, 1981
907.708
+195.59
27.47%
jan 1, 1982
699.515
-208.193
-22.94%
jan 1, 1983
688.517
-10.998
-1.57%
jan 1, 1984
613.459
-75.058
-10.9%
jan 1, 1985
544.033
-69.426
-11.32%
jan 1, 1986
532.526
-11.507
-2.12%
jan 1, 1987
705.498
+172.972
32.48%
jan 1, 1988
758.167
+52.669
7.47%
jan 1, 1989
874.418
+116.251
15.33%
jan 1, 1990
888.724
+14.306
1.64%
jan 1, 1991
1.005K
+115.974
13.05%
jan 1, 1992
1.055K
+50.131
4.99%
jan 1, 1993
1.061K
+6.194
0.59%
jan 1, 1994
966.359
-94.665
-8.92%
jan 1, 1995
1.082K
+115.953
12.0%
jan 1, 1996
1.153K
+70.81
6.54%
jan 1, 1997
1.274K
+120.72
10.47%
jan 1, 1998
1.119K
-155.222
-12.19%
jan 1, 1999
1.2K
+80.923
7.23%
jan 1, 2000
1.17K
-29.97
-2.5%
jan 1, 2001
1.067K
-102.327
-8.75%
jan 1, 2002
1.082K
+14.754
1.38%
jan 1, 2003
1.153K
+70.784
6.54%
jan 1, 2004
1.426K
+273.243
23.7%
jan 1, 2005
1.624K
+198.089
13.89%
jan 1, 2006
1.689K
+64.828
3.99%
jan 1, 2007
1.849K
+159.743
9.46%
jan 1, 2008
2.196K
+347.699
18.81%
jan 1, 2009
2.435K
+238.899
10.88%
jan 1, 2010
2.46K
+25.046
1.03%
jan 1, 2011
2.41K
-50.371
-2.05%
jan 1, 2012
2.55K
+140.004
5.81%
jan 1, 2013
2.422K
-128.431
-5.04%
jan 1, 2014
2.635K
+213.627
8.82%
jan 1, 2015
2.666K
+30.355
1.15%
Ranking of countries by current statistics by years


Comments: