29
/
en
AIzaSyAYiBZKx7MnpbEhh9jyipgxe19OcubqV5w
April 1, 2024
96975
Cabo Verde
CPV
true
2
1
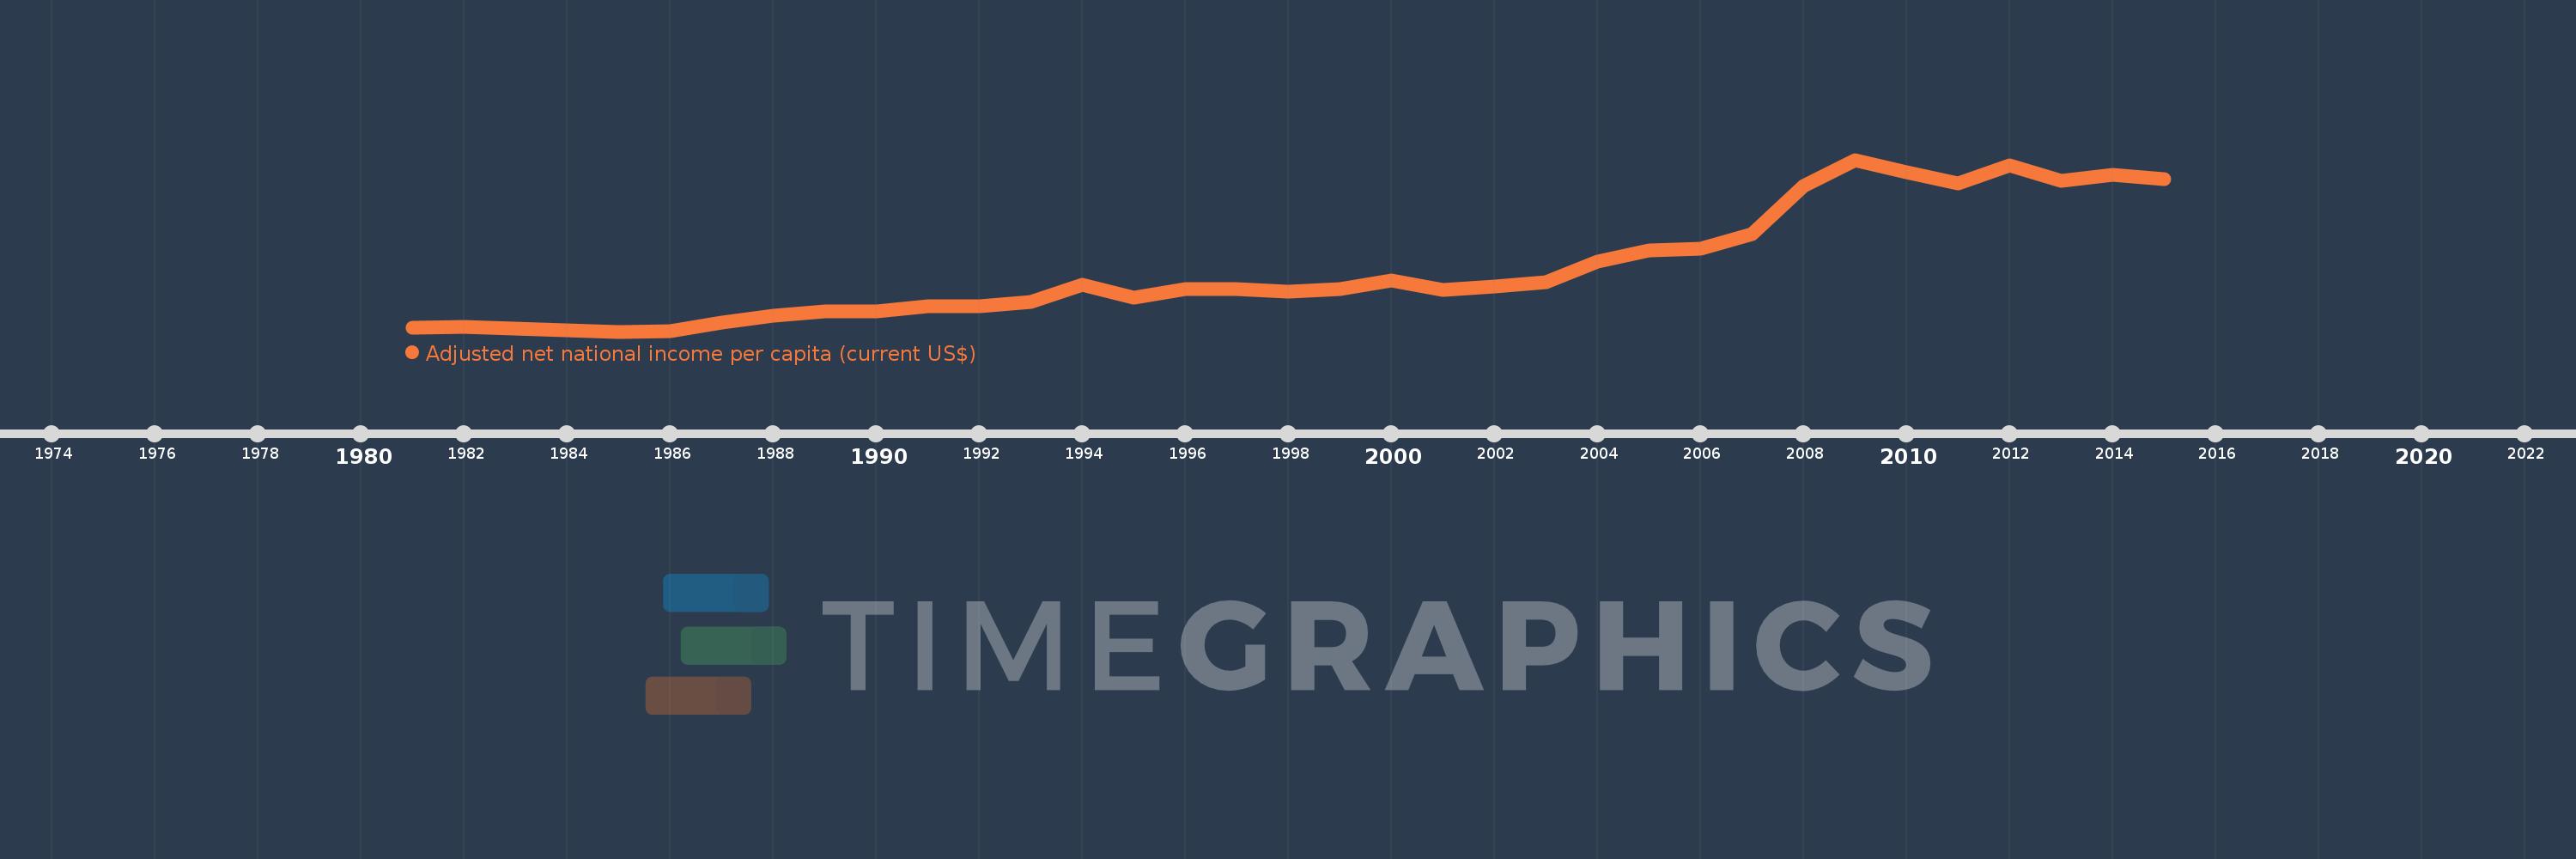
Adjusted net national income per capita (current US$)
2015,2014,2013,2012,2011,2010,2009,2008,2007,2006,2005,2004,2003,2002,2001,2000,1999,1998,1997,1996,1995,1994,1993,1992,1991,1990,1989,1988,1987,1986,1985,1984,1983,1982,1981
This statistics in other country:
AfghanistanAlbaniaAlgeriaAngolaArab WorldArgentinaArmeniaAustraliaAustriaAzerbaijanBahamas, TheBahrainBangladeshBarbadosBelarusBelgiumBelizeBeninBhutanBoliviaBotswanaBrazilBrunei DarussalamBulgariaBurkina FasoBurundiCabo VerdeCambodiaCameroonCanadaCaribbean small statesCentral African RepublicCentral Europe and the BalticsChadChileChinaColombiaComorosCongo, Dem. Rep.Congo, Rep.Costa RicaCote d'IvoireCroatiaCubaCyprusCzech RepublicDenmarkDjiboutiDominicaDominican RepublicEarly-demographic dividendEast Asia & PacificEast Asia & Pacific (excluding high income)East Asia & Pacific (IDA & IBRD countries)EcuadorEgypt, Arab Rep.El SalvadorEquatorial GuineaEritreaEstoniaEthiopiaEuro areaEurope & Central AsiaEurope & Central Asia (excluding high income)Europe & Central Asia (IDA & IBRD countries)European UnionFijiFinlandFragile and conflict affected situationsFranceGabonGambia, TheGeorgiaGermanyGhanaGreeceGuatemalaGuineaGuinea-BissauGuyanaHaitiHeavily indebted poor countries (HIPC)High incomeHondurasHong Kong SAR, ChinaHungaryIBRD onlyIcelandIDA & IBRD totalIDA blendIDA onlyIDA totalIndiaIndonesiaIran, Islamic Rep.IraqIrelandIsraelItalyJamaicaJapanJordanKazakhstanKenyaKiribatiKorea, Rep.KuwaitKyrgyz RepublicLao PDRLate-demographic dividendLatin America & Caribbean Latin America & Caribbean (excluding high income)Latin America & the Caribbean (IDA & IBRD countries)LatviaLeast developed countries: UN classificationLebanonLesothoLiberiaLibyaLithuaniaLow & middle incomeLow incomeLower middle incomeLuxembourgMacedonia, FYRMadagascarMalawiMalaysiaMaldivesMaliMauritaniaMauritiusMexicoMiddle East & North AfricaMiddle East & North Africa (excluding high income)Middle East & North Africa (IDA & IBRD countries)Middle incomeMoldovaMongoliaMoroccoMozambiqueMyanmarNamibiaNepalNetherlandsNew ZealandNicaraguaNigerNigeriaNorth AmericaNorwayOECD membersOmanOther small statesPacific island small statesPakistanPanamaPapua New GuineaParaguayPeruPhilippinesPolandPortugalPost-demographic dividendPre-demographic dividendQatarRomaniaRussian FederationRwandaSamoaSao Tome and PrincipeSaudi ArabiaSenegalSeychellesSierra LeoneSingaporeSlovak RepublicSloveniaSmall statesSolomon IslandsSouth AfricaSouth AsiaSouth Asia (IDA & IBRD)SpainSri LankaSt. LuciaSt. Vincent and the GrenadinesSub-Saharan Africa Sub-Saharan Africa (excluding high income)Sub-Saharan Africa (IDA & IBRD countries)SudanSurinameSwazilandSwedenSwitzerlandSyrian Arab RepublicTajikistanTanzaniaThailandTogoTongaTrinidad and TobagoTunisiaTurkeyTurkmenistanUgandaUkraineUnited Arab EmiratesUnited KingdomUnited StatesUpper middle incomeUruguayUzbekistanVanuatuVenezuela, RBVietnamWorldYemen, Rep.ZambiaZimbabwe Timeline:
This timeline shows a graph from 1981 to 2015 of Cabo Verde. No data until 1980. Number of actual observations by date: 35.
Source name:
World Development Indicators
Source organization:
World Bank staff estimates based on sources and methods in World Bank's "The Changing Wealth of Nations: Measuring Sustainable Development in the New Millennium" (2011).
Categories, topics:
Economy & Growth
Last updated:
apr 23, 2017
Indicators value changes by year
Minimum:
340.062
jan 1, 1985
At the date of observation
Value
Absolute change
Change from previous value
jan 1, 1981
405.532
+405.532
0.0%
jan 1, 1982
409.012
+3.481
0.86%
jan 1, 1983
383.263
-25.749
-6.3%
jan 1, 1984
361.92
-21.343
-5.57%
jan 1, 1985
340.062
-21.858
-6.04%
jan 1, 1986
350.386
+10.324
3.04%
jan 1, 1987
478.669
+128.283
36.61%
jan 1, 1988
587.748
+109.079
22.79%
jan 1, 1989
652.412
+64.664
11.0%
jan 1, 1990
656.663
+4.25
0.65%
jan 1, 1991
726.496
+69.833
10.63%
jan 1, 1992
729.246
+2.75
0.38%
jan 1, 1993
790.806
+61.56
8.44%
jan 1, 1994
1.067K
+276.402
34.95%
jan 1, 1995
861.243
-205.965
-19.3%
jan 1, 1996
992.022
+130.779
15.18%
jan 1, 1997
998.068
+6.046
0.61%
jan 1, 1998
953.444
-44.624
-4.47%
jan 1, 1999
994.94
+41.495
4.35%
jan 1, 2000
1.124K
+129.053
12.97%
jan 1, 2001
985.807
-138.186
-12.29%
jan 1, 2002
1.033K
+47.202
4.79%
jan 1, 2003
1.102K
+69.29
6.71%
jan 1, 2004
1.419K
+316.613
28.72%
jan 1, 2005
1.591K
+171.67
12.1%
jan 1, 2006
1.614K
+23.729
1.49%
jan 1, 2007
1.838K
+224.038
13.88%
jan 1, 2008
2.584K
+745.668
40.56%
jan 1, 2009
2.99K
+406.272
15.72%
jan 1, 2010
2.792K
-198.514
-6.64%
jan 1, 2011
2.63K
-162.266
-5.81%
jan 1, 2012
2.91K
+280.145
10.65%
jan 1, 2013
2.66K
-249.925
-8.59%
jan 1, 2014
2.755K
+95.736
3.6%
jan 1, 2015
2.688K
-67.665
-2.46%
Ranking of countries by current statistics by years


Comments: