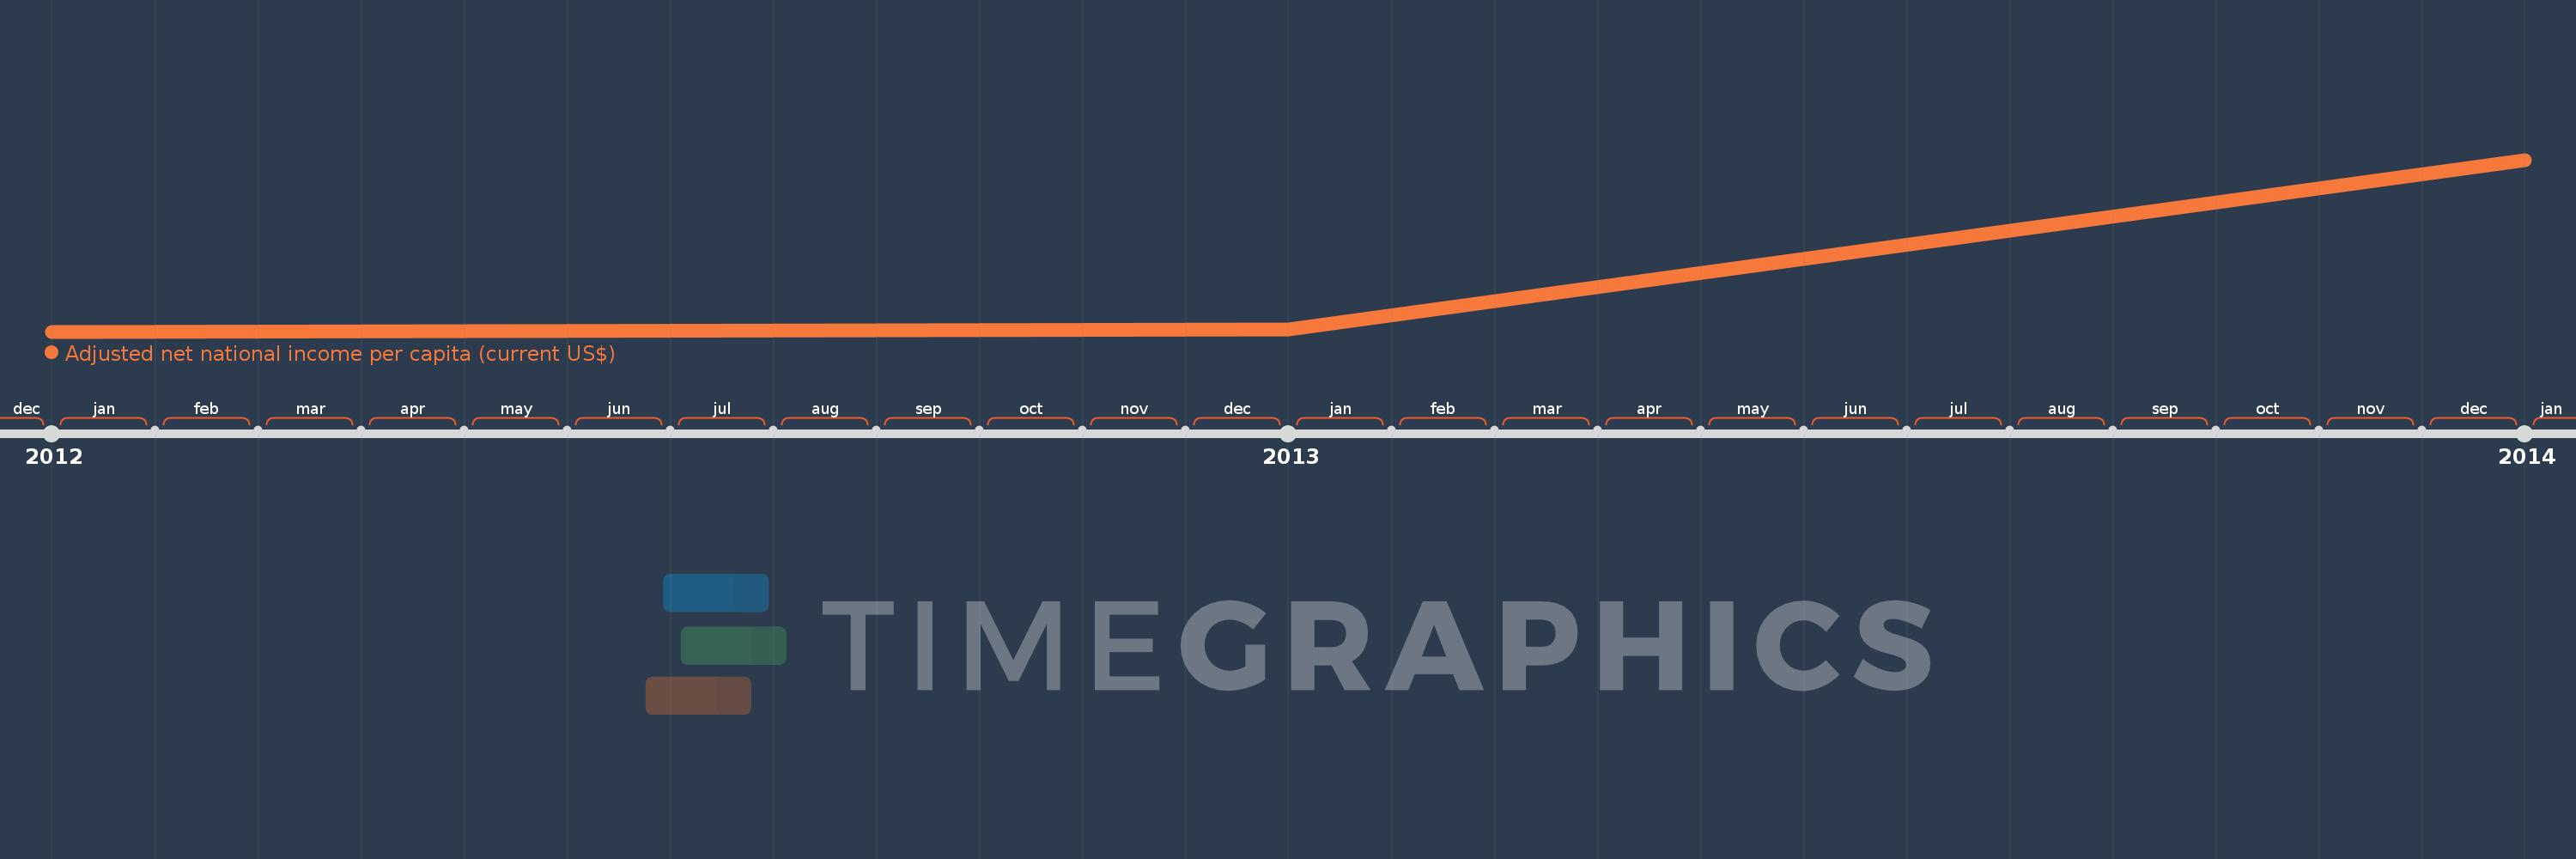
This timeline shows a graph from 2012 to 2014 of Iceland. No data until 2011. Number of actual observations by date: 3.
Source name:
World Development Indicators
Source organization:
World Bank staff estimates based on sources and methods in World Bank's "The Changing Wealth of Nations: Measuring Sustainable Development in the New Millennium" (2011).
Categories, topics:
Economy & Growth
Last updated:
apr 23, 2017
Indicators value changes by year
Meaning:
34.456K
Minimum:
32.299K
jan 1, 2012
Maximum:
38.683K
jan 1, 2014
At the date of observation
Value
Absolute change
Change from the previous value
jan 1, 2012
32.299K
+32.299K
0.0%
jan 1, 2013
32.385K
+85.822
0.27%
jan 1, 2014
38.683K
+6.299K
19.45%
Ranking of countries by current statistics by years
