29
/
en
AIzaSyAYiBZKx7MnpbEhh9jyipgxe19OcubqV5w
April 1, 2024
279460
Vanuatu
VUT
true
2
1
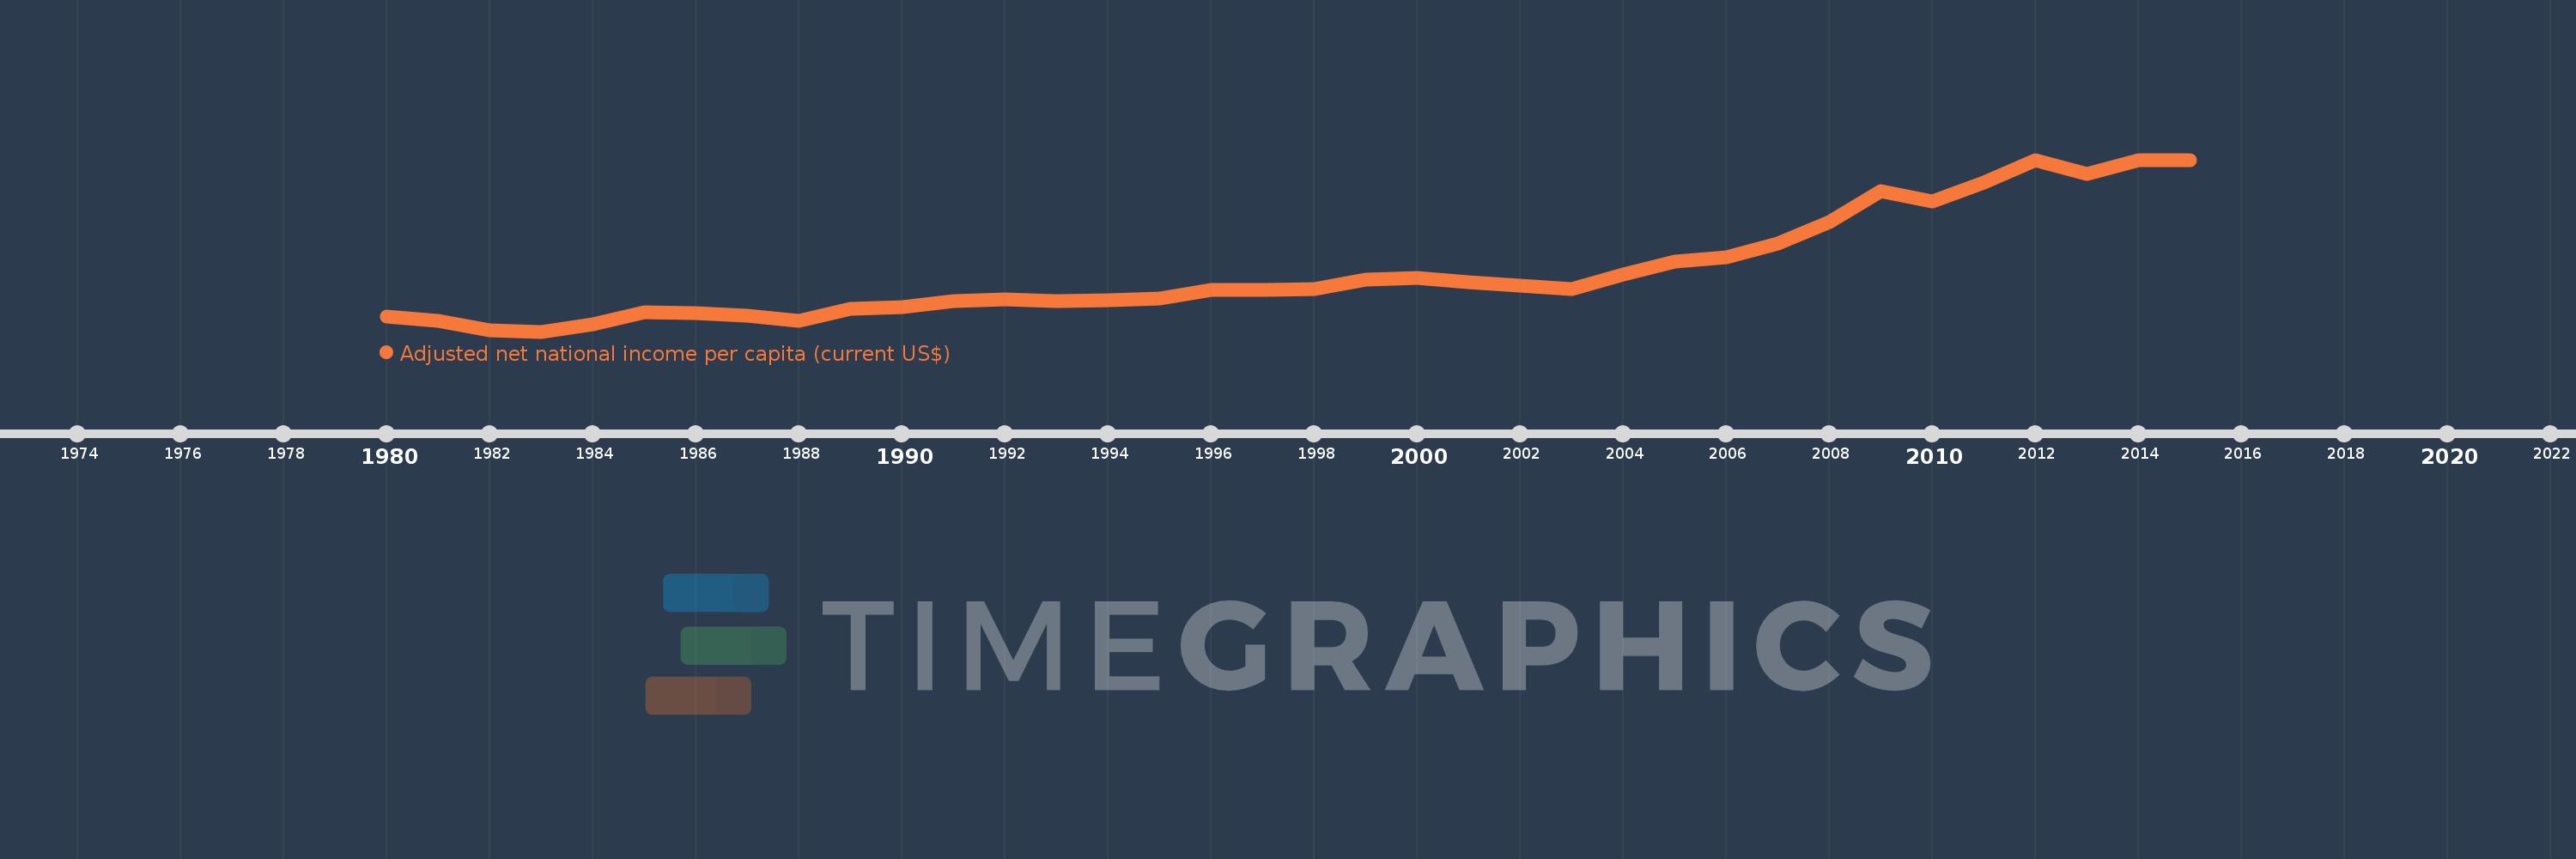
Adjusted net national income per capita (current US$)
2015,2014,2013,2012,2011,2010,2009,2008,2007,2006,2005,2004,2003,2002,2001,2000,1999,1998,1997,1996,1995,1994,1993,1992,1991,1990,1989,1988,1987,1986,1985,1984,1983,1982,1981,1980
This statistics in other country:
AfghanistanAlbaniaAlgeriaAngolaArab WorldArgentinaArmeniaAustraliaAustriaAzerbaijanBahamas, TheBahrainBangladeshBarbadosBelarusBelgiumBelizeBeninBhutanBoliviaBotswanaBrazilBrunei DarussalamBulgariaBurkina FasoBurundiCabo VerdeCambodiaCameroonCanadaCaribbean small statesCentral African RepublicCentral Europe and the BalticsChadChileChinaColombiaComorosCongo, Dem. Rep.Congo, Rep.Costa RicaCote d'IvoireCroatiaCubaCyprusCzech RepublicDenmarkDjiboutiDominicaDominican RepublicEarly-demographic dividendEast Asia & PacificEast Asia & Pacific (excluding high income)East Asia & Pacific (IDA & IBRD countries)EcuadorEgypt, Arab Rep.El SalvadorEquatorial GuineaEritreaEstoniaEthiopiaEuro areaEurope & Central AsiaEurope & Central Asia (excluding high income)Europe & Central Asia (IDA & IBRD countries)European UnionFijiFinlandFragile and conflict affected situationsFranceGabonGambia, TheGeorgiaGermanyGhanaGreeceGuatemalaGuineaGuinea-BissauGuyanaHaitiHeavily indebted poor countries (HIPC)High incomeHondurasHong Kong SAR, ChinaHungaryIBRD onlyIcelandIDA & IBRD totalIDA blendIDA onlyIDA totalIndiaIndonesiaIran, Islamic Rep.IraqIrelandIsraelItalyJamaicaJapanJordanKazakhstanKenyaKiribatiKorea, Rep.KuwaitKyrgyz RepublicLao PDRLate-demographic dividendLatin America & Caribbean Latin America & Caribbean (excluding high income)Latin America & the Caribbean (IDA & IBRD countries)LatviaLeast developed countries: UN classificationLebanonLesothoLiberiaLibyaLithuaniaLow & middle incomeLow incomeLower middle incomeLuxembourgMacedonia, FYRMadagascarMalawiMalaysiaMaldivesMaliMauritaniaMauritiusMexicoMiddle East & North AfricaMiddle East & North Africa (excluding high income)Middle East & North Africa (IDA & IBRD countries)Middle incomeMoldovaMongoliaMoroccoMozambiqueMyanmarNamibiaNepalNetherlandsNew ZealandNicaraguaNigerNigeriaNorth AmericaNorwayOECD membersOmanOther small statesPacific island small statesPakistanPanamaPapua New GuineaParaguayPeruPhilippinesPolandPortugalPost-demographic dividendPre-demographic dividendQatarRomaniaRussian FederationRwandaSamoaSao Tome and PrincipeSaudi ArabiaSenegalSeychellesSierra LeoneSingaporeSlovak RepublicSloveniaSmall statesSolomon IslandsSouth AfricaSouth AsiaSouth Asia (IDA & IBRD)SpainSri LankaSt. LuciaSt. Vincent and the GrenadinesSub-Saharan Africa Sub-Saharan Africa (excluding high income)Sub-Saharan Africa (IDA & IBRD countries)SudanSurinameSwazilandSwedenSwitzerlandSyrian Arab RepublicTajikistanTanzaniaThailandTogoTongaTrinidad and TobagoTunisiaTurkeyTurkmenistanUgandaUkraineUnited Arab EmiratesUnited KingdomUnited StatesUpper middle incomeUruguayUzbekistanVanuatuVenezuela, RBVietnamWorldYemen, Rep.ZambiaZimbabwe Timeline:
This timeline shows a graph from 1980 to 2015 of Vanuatu. No data until 1979. Number of actual observations by date: 36.
Source name:
World Development Indicators
Source organization:
World Bank staff estimates based on sources and methods in World Bank's "The Changing Wealth of Nations: Measuring Sustainable Development in the New Millennium" (2011).
Categories, topics:
Economy & Growth
Last updated:
apr 23, 2017
Indicators value changes by year
Minimum:
619.431
jan 1, 1983
Maximum:
2.875K
jan 1, 2012
At the date of observation
Value
Absolute change
Change from previous value
jan 1, 1980
816.734
+816.734
0.0%
jan 1, 1981
756.434
-60.3
-7.38%
jan 1, 1982
631.628
-124.806
-16.5%
jan 1, 1983
619.431
-12.196
-1.93%
jan 1, 1984
719.274
+99.843
16.12%
jan 1, 1985
871.195
+151.921
21.12%
jan 1, 1986
866.041
-5.154
-0.59%
jan 1, 1987
822.527
-43.513
-5.02%
jan 1, 1988
760.927
-61.601
-7.49%
jan 1, 1989
916.444
+155.518
20.44%
jan 1, 1990
936.214
+19.77
2.16%
jan 1, 1991
1.017K
+81.168
8.67%
jan 1, 1992
1.038K
+20.966
2.06%
jan 1, 1993
1.017K
-21.168
-2.04%
jan 1, 1994
1.035K
+17.564
1.73%
jan 1, 1995
1.049K
+14.704
1.42%
jan 1, 1996
1.172K
+122.455
11.67%
jan 1, 1997
1.166K
-5.902
-0.5%
jan 1, 1998
1.18K
+13.89
1.19%
jan 1, 1999
1.302K
+121.821
10.32%
jan 1, 2000
1.325K
+23.669
1.82%
jan 1, 2001
1.272K
-53.735
-4.05%
jan 1, 2002
1.227K
-44.154
-3.47%
jan 1, 2003
1.183K
-44.188
-3.6%
jan 1, 2004
1.371K
+188.022
15.89%
jan 1, 2005
1.544K
+172.859
12.61%
jan 1, 2006
1.6K
+55.948
3.62%
jan 1, 2007
1.779K
+178.973
11.18%
jan 1, 2008
2.062K
+283.066
15.91%
jan 1, 2009
2.469K
+406.697
19.72%
jan 1, 2010
2.325K
-144.301
-5.84%
jan 1, 2011
2.579K
+254.37
10.94%
jan 1, 2012
2.875K
+296.208
11.49%
jan 1, 2013
2.692K
-183.455
-6.38%
jan 1, 2014
2.872K
+180.17
6.69%
jan 1, 2015
2.869K
-2.64
-0.09%
Ranking of countries by current statistics by years


Comments: