29
/
en
AIzaSyAYiBZKx7MnpbEhh9jyipgxe19OcubqV5w
April 1, 2024
257957
Syrian Arab Republic
SYR
true
2
1
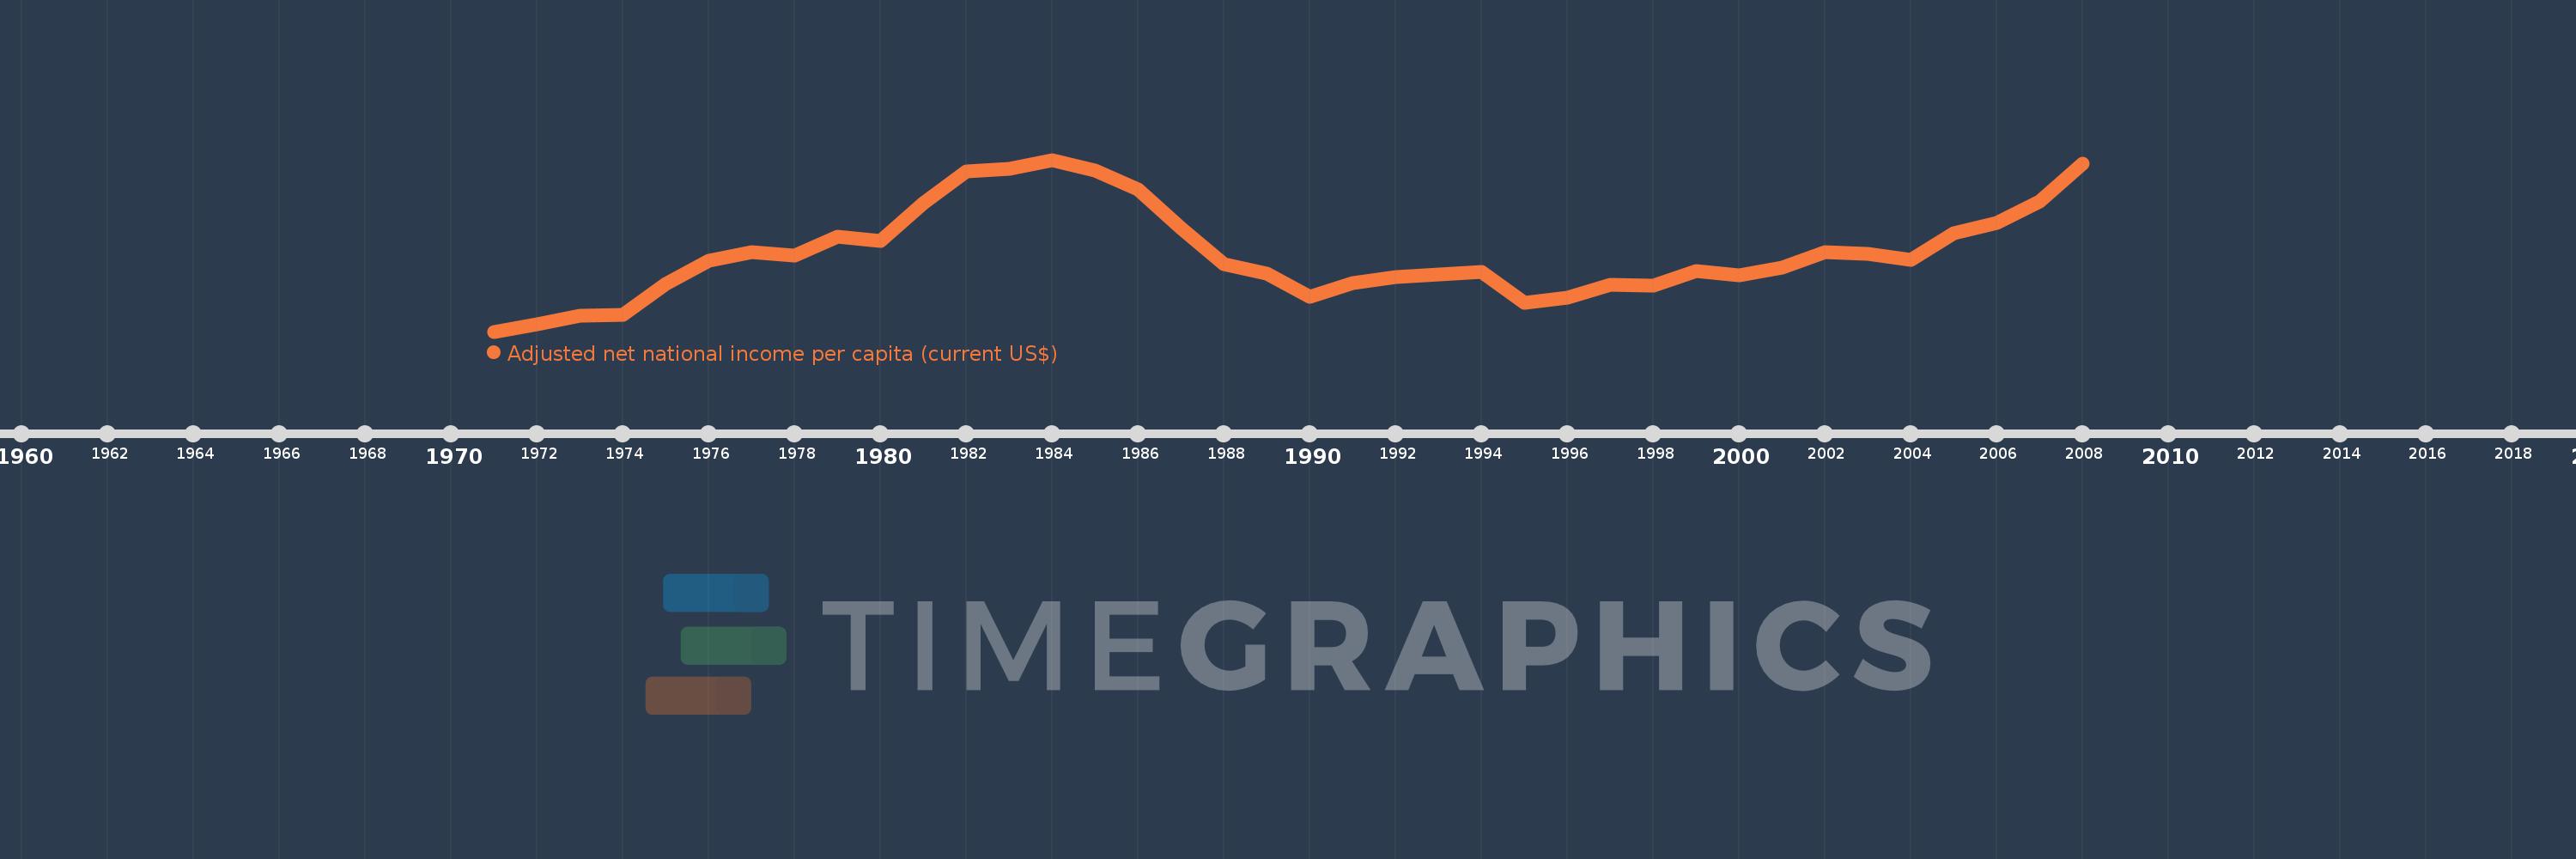
Adjusted net national income per capita (current US$)
2008,2007,2006,2005,2004,2003,2002,2001,2000,1999,1998,1997,1996,1995,1994,1993,1992,1991,1990,1989,1988,1987,1986,1985,1984,1983,1982,1981,1980,1979,1978,1977,1976,1975,1974,1973,1972,1971
This statistics in other country:
AfghanistanAlbaniaAlgeriaAngolaArab WorldArgentinaArmeniaAustraliaAustriaAzerbaijanBahamas, TheBahrainBangladeshBarbadosBelarusBelgiumBelizeBeninBhutanBoliviaBotswanaBrazilBrunei DarussalamBulgariaBurkina FasoBurundiCabo VerdeCambodiaCameroonCanadaCaribbean small statesCentral African RepublicCentral Europe and the BalticsChadChileChinaColombiaComorosCongo, Dem. Rep.Congo, Rep.Costa RicaCote d'IvoireCroatiaCubaCyprusCzech RepublicDenmarkDjiboutiDominicaDominican RepublicEarly-demographic dividendEast Asia & PacificEast Asia & Pacific (excluding high income)East Asia & Pacific (IDA & IBRD countries)EcuadorEgypt, Arab Rep.El SalvadorEquatorial GuineaEritreaEstoniaEthiopiaEuro areaEurope & Central AsiaEurope & Central Asia (excluding high income)Europe & Central Asia (IDA & IBRD countries)European UnionFijiFinlandFragile and conflict affected situationsFranceGabonGambia, TheGeorgiaGermanyGhanaGreeceGuatemalaGuineaGuinea-BissauGuyanaHaitiHeavily indebted poor countries (HIPC)High incomeHondurasHong Kong SAR, ChinaHungaryIBRD onlyIcelandIDA & IBRD totalIDA blendIDA onlyIDA totalIndiaIndonesiaIran, Islamic Rep.IraqIrelandIsraelItalyJamaicaJapanJordanKazakhstanKenyaKiribatiKorea, Rep.KuwaitKyrgyz RepublicLao PDRLate-demographic dividendLatin America & Caribbean Latin America & Caribbean (excluding high income)Latin America & the Caribbean (IDA & IBRD countries)LatviaLeast developed countries: UN classificationLebanonLesothoLiberiaLibyaLithuaniaLow & middle incomeLow incomeLower middle incomeLuxembourgMacedonia, FYRMadagascarMalawiMalaysiaMaldivesMaliMauritaniaMauritiusMexicoMiddle East & North AfricaMiddle East & North Africa (excluding high income)Middle East & North Africa (IDA & IBRD countries)Middle incomeMoldovaMongoliaMoroccoMozambiqueMyanmarNamibiaNepalNetherlandsNew ZealandNicaraguaNigerNigeriaNorth AmericaNorwayOECD membersOmanOther small statesPacific island small statesPakistanPanamaPapua New GuineaParaguayPeruPhilippinesPolandPortugalPost-demographic dividendPre-demographic dividendQatarRomaniaRussian FederationRwandaSamoaSao Tome and PrincipeSaudi ArabiaSenegalSeychellesSierra LeoneSingaporeSlovak RepublicSloveniaSmall statesSolomon IslandsSouth AfricaSouth AsiaSouth Asia (IDA & IBRD)SpainSri LankaSt. LuciaSt. Vincent and the GrenadinesSub-Saharan Africa Sub-Saharan Africa (excluding high income)Sub-Saharan Africa (IDA & IBRD countries)SudanSurinameSwazilandSwedenSwitzerlandSyrian Arab RepublicTajikistanTanzaniaThailandTogoTongaTrinidad and TobagoTunisiaTurkeyTurkmenistanUgandaUkraineUnited Arab EmiratesUnited KingdomUnited StatesUpper middle incomeUruguayUzbekistanVanuatuVenezuela, RBVietnamWorldYemen, Rep.ZambiaZimbabwe Timeline:
This timeline shows a graph from 1971 to 2008 of Syrian Arab Republic. No data until 1970. Number of actual observations by date: 38.
Source name:
World Development Indicators
Source organization:
World Bank staff estimates based on sources and methods in World Bank's "The Changing Wealth of Nations: Measuring Sustainable Development in the New Millennium" (2011).
Categories, topics:
Economy & Growth
Last updated:
apr 23, 2017
Indicators value changes by year
Minimum:
332.959
jan 1, 1971
Maximum:
1.648K
jan 1, 1984
At the date of observation
Value
Absolute change
Change from previous value
jan 1, 1971
332.959
+332.959
0.0%
jan 1, 1972
391.587
+58.628
17.61%
jan 1, 1973
456.089
+64.502
16.47%
jan 1, 1974
458.578
+2.49
0.55%
jan 1, 1975
694.632
+236.053
51.48%
jan 1, 1976
873.37
+178.738
25.73%
jan 1, 1977
938.539
+65.169
7.46%
jan 1, 1978
915.104
-23.435
-2.5%
jan 1, 1979
1.061K
+146.014
15.96%
jan 1, 1980
1.024K
-37.395
-3.52%
jan 1, 1981
1.318K
+294.675
28.78%
jan 1, 1982
1.561K
+242.617
18.4%
jan 1, 1983
1.58K
+19.189
1.23%
jan 1, 1984
1.648K
+67.568
4.28%
jan 1, 1985
1.564K
-84.199
-5.11%
jan 1, 1986
1.424K
-139.906
-8.95%
jan 1, 1987
1.125K
-298.482
-20.97%
jan 1, 1988
846.854
-278.329
-24.74%
jan 1, 1989
779.072
-67.782
-8.0%
jan 1, 1990
601.943
-177.129
-22.74%
jan 1, 1991
701.432
+99.49
16.53%
jan 1, 1992
753.448
+52.016
7.42%
jan 1, 1993
769.194
+15.745
2.09%
jan 1, 1994
792.266
+23.072
3.0%
jan 1, 1995
551.979
-240.287
-30.33%
jan 1, 1996
595.194
+43.215
7.83%
jan 1, 1997
691.252
+96.058
16.14%
jan 1, 1998
686.253
-4.999
-0.72%
jan 1, 1999
793.317
+107.064
15.6%
jan 1, 2000
760.282
-33.036
-4.16%
jan 1, 2001
820.771
+60.489
7.96%
jan 1, 2002
944.188
+123.418
15.04%
jan 1, 2003
924.694
-19.495
-2.06%
jan 1, 2004
882.838
-41.856
-4.53%
jan 1, 2005
1.087K
+203.748
23.08%
jan 1, 2006
1.166K
+79.205
7.29%
jan 1, 2007
1.328K
+162.4
13.93%
jan 1, 2008
1.615K
+286.827
21.6%
Ranking of countries by current statistics by years


Comments: