29
/
en
AIzaSyAYiBZKx7MnpbEhh9jyipgxe19OcubqV5w
April 1, 2024
143933
Guatemala
GTM
true
2
1
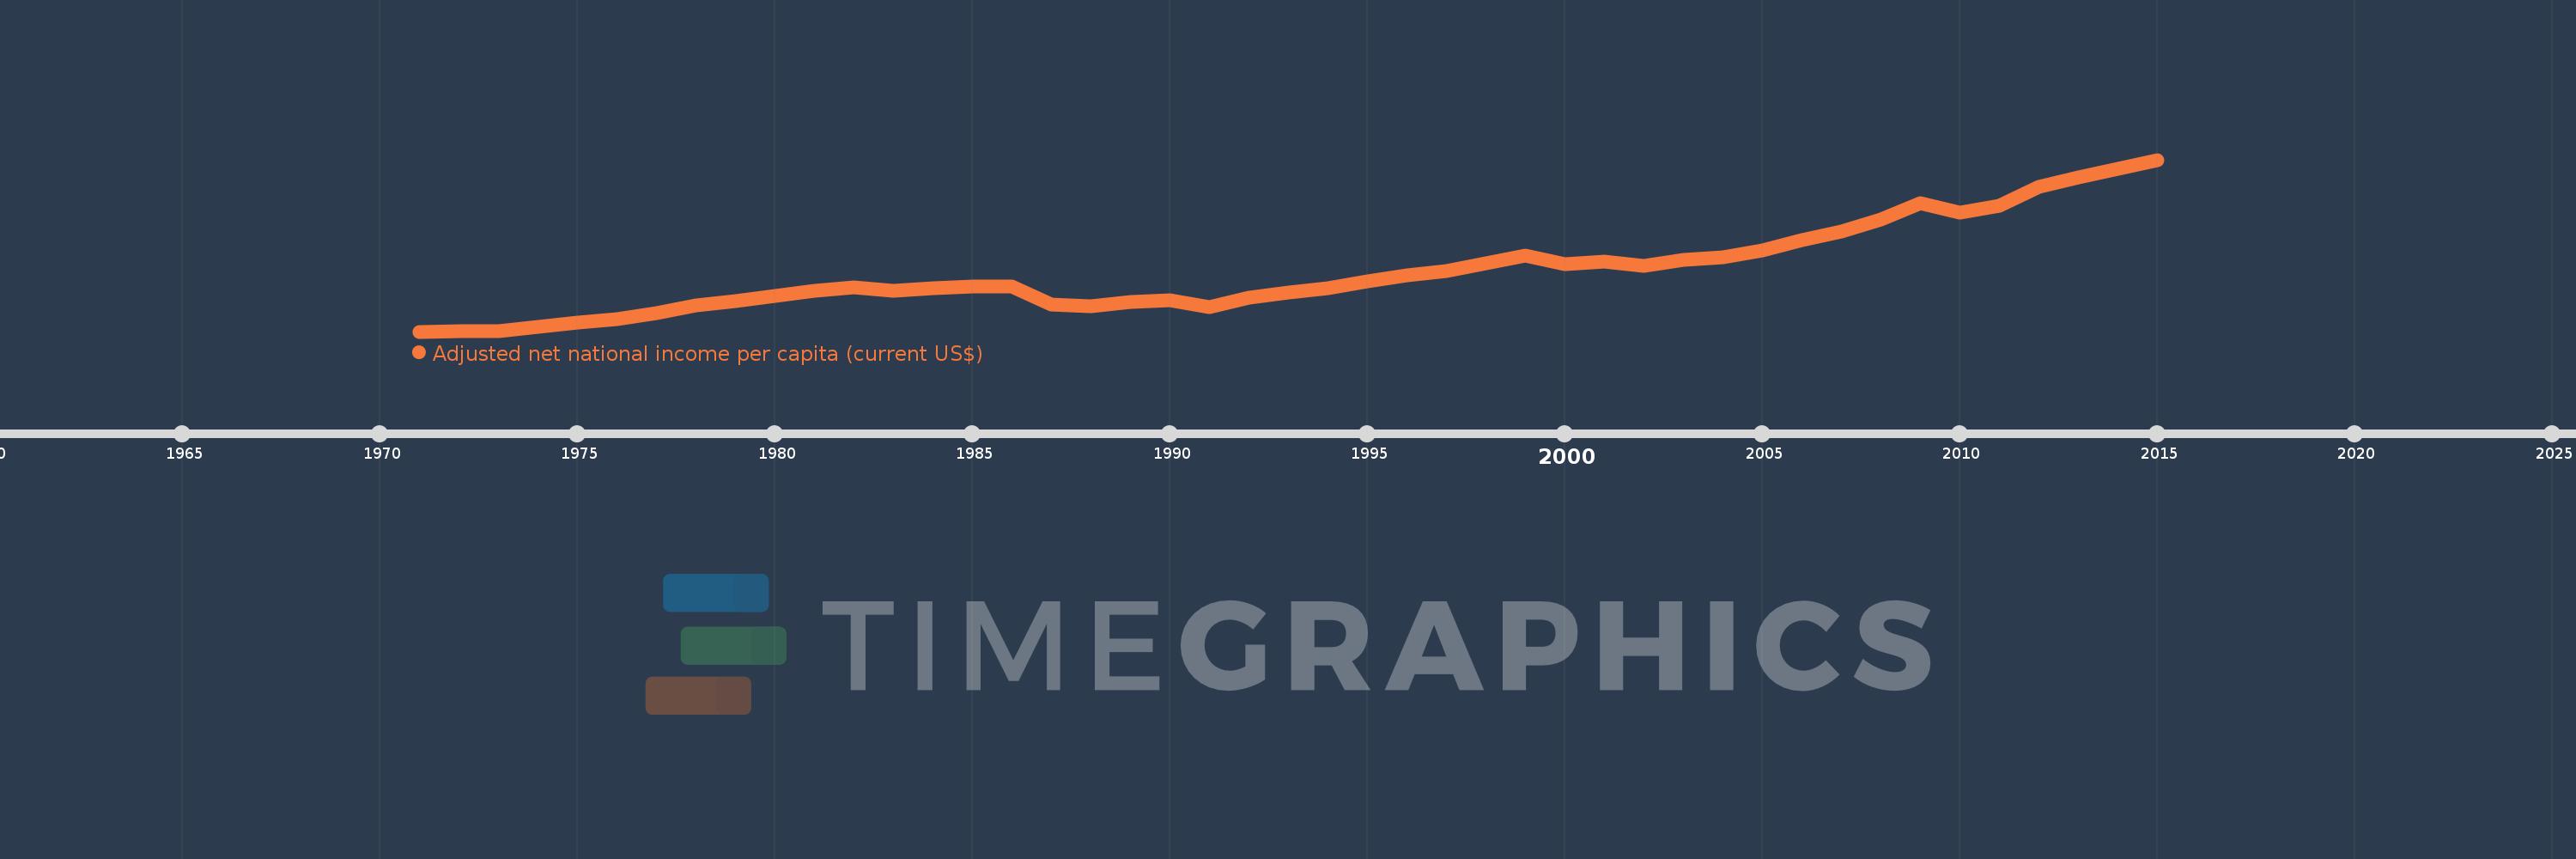
Adjusted net national income per capita (current US$)
2015,2014,2013,2012,2011,2010,2009,2008,2007,2006,2005,2004,2003,2002,2001,2000,1999,1998,1997,1996,1995,1994,1993,1992,1991,1990,1989,1988,1987,1986,1985,1984,1983,1982,1981,1980,1979,1978,1977,1976,1975,1974,1973,1972,1971
This statistics in other country:
AfghanistanAlbaniaAlgeriaAngolaArab WorldArgentinaArmeniaAustraliaAustriaAzerbaijanBahamas, TheBahrainBangladeshBarbadosBelarusBelgiumBelizeBeninBhutanBoliviaBotswanaBrazilBrunei DarussalamBulgariaBurkina FasoBurundiCabo VerdeCambodiaCameroonCanadaCaribbean small statesCentral African RepublicCentral Europe and the BalticsChadChileChinaColombiaComorosCongo, Dem. Rep.Congo, Rep.Costa RicaCote d'IvoireCroatiaCubaCyprusCzech RepublicDenmarkDjiboutiDominicaDominican RepublicEarly-demographic dividendEast Asia & PacificEast Asia & Pacific (excluding high income)East Asia & Pacific (IDA & IBRD countries)EcuadorEgypt, Arab Rep.El SalvadorEquatorial GuineaEritreaEstoniaEthiopiaEuro areaEurope & Central AsiaEurope & Central Asia (excluding high income)Europe & Central Asia (IDA & IBRD countries)European UnionFijiFinlandFragile and conflict affected situationsFranceGabonGambia, TheGeorgiaGermanyGhanaGreeceGuatemalaGuineaGuinea-BissauGuyanaHaitiHeavily indebted poor countries (HIPC)High incomeHondurasHong Kong SAR, ChinaHungaryIBRD onlyIcelandIDA & IBRD totalIDA blendIDA onlyIDA totalIndiaIndonesiaIran, Islamic Rep.IraqIrelandIsraelItalyJamaicaJapanJordanKazakhstanKenyaKiribatiKorea, Rep.KuwaitKyrgyz RepublicLao PDRLate-demographic dividendLatin America & Caribbean Latin America & Caribbean (excluding high income)Latin America & the Caribbean (IDA & IBRD countries)LatviaLeast developed countries: UN classificationLebanonLesothoLiberiaLibyaLithuaniaLow & middle incomeLow incomeLower middle incomeLuxembourgMacedonia, FYRMadagascarMalawiMalaysiaMaldivesMaliMauritaniaMauritiusMexicoMiddle East & North AfricaMiddle East & North Africa (excluding high income)Middle East & North Africa (IDA & IBRD countries)Middle incomeMoldovaMongoliaMoroccoMozambiqueMyanmarNamibiaNepalNetherlandsNew ZealandNicaraguaNigerNigeriaNorth AmericaNorwayOECD membersOmanOther small statesPacific island small statesPakistanPanamaPapua New GuineaParaguayPeruPhilippinesPolandPortugalPost-demographic dividendPre-demographic dividendQatarRomaniaRussian FederationRwandaSamoaSao Tome and PrincipeSaudi ArabiaSenegalSeychellesSierra LeoneSingaporeSlovak RepublicSloveniaSmall statesSolomon IslandsSouth AfricaSouth AsiaSouth Asia (IDA & IBRD)SpainSri LankaSt. LuciaSt. Vincent and the GrenadinesSub-Saharan Africa Sub-Saharan Africa (excluding high income)Sub-Saharan Africa (IDA & IBRD countries)SudanSurinameSwazilandSwedenSwitzerlandSyrian Arab RepublicTajikistanTanzaniaThailandTogoTongaTrinidad and TobagoTunisiaTurkeyTurkmenistanUgandaUkraineUnited Arab EmiratesUnited KingdomUnited StatesUpper middle incomeUruguayUzbekistanVanuatuVenezuela, RBVietnamWorldYemen, Rep.ZambiaZimbabwe Timeline:
This timeline shows a graph from 1971 to 2015 of Guatemala. No data until 1970. Number of actual observations by date: 45.
Source name:
World Development Indicators
Source organization:
World Bank staff estimates based on sources and methods in World Bank's "The Changing Wealth of Nations: Measuring Sustainable Development in the New Millennium" (2011).
Categories, topics:
Economy & Growth
Last updated:
apr 23, 2017
Indicators value changes by year
Minimum:
316.561
jan 1, 1971
Maximum:
3.158K
jan 1, 2015
At the date of observation
Value
Absolute change
Change from previous value
jan 1, 1971
316.561
+316.561
0.0%
jan 1, 1972
321.634
+5.073
1.6%
jan 1, 1973
329.318
+7.684
2.39%
jan 1, 1974
389.726
+60.408
18.34%
jan 1, 1975
470.12
+80.395
20.63%
jan 1, 1976
521.091
+50.97
10.84%
jan 1, 1977
619.121
+98.03
18.81%
jan 1, 1978
754.47
+135.349
21.86%
jan 1, 1979
816.091
+61.621
8.17%
jan 1, 1980
900.404
+84.313
10.33%
jan 1, 1981
984.623
+84.219
9.35%
jan 1, 1982
1.049K
+64.441
6.54%
jan 1, 1983
992.049
-57.015
-5.43%
jan 1, 1984
1.039K
+47.174
4.76%
jan 1, 1985
1.063K
+23.718
2.28%
jan 1, 1986
1.067K
+3.91
0.37%
jan 1, 1987
761.95
-304.902
-28.58%
jan 1, 1988
734.393
-27.556
-3.62%
jan 1, 1989
799.71
+65.316
8.89%
jan 1, 1990
840.737
+41.027
5.13%
jan 1, 1991
722.591
-118.145
-14.05%
jan 1, 1992
879.529
+156.938
21.72%
jan 1, 1993
959.7
+80.17
9.12%
jan 1, 1994
1.033K
+72.917
7.6%
jan 1, 1995
1.143K
+110.454
10.7%
jan 1, 1996
1.25K
+107.154
9.37%
jan 1, 1997
1.322K
+72.071
5.76%
jan 1, 1998
1.452K
+129.302
9.78%
jan 1, 1999
1.569K
+117.235
8.08%
jan 1, 2000
1.438K
-130.375
-8.31%
jan 1, 2001
1.476K
+37.396
2.6%
jan 1, 2002
1.398K
-77.581
-5.26%
jan 1, 2003
1.507K
+109.03
7.8%
jan 1, 2004
1.55K
+42.475
2.82%
jan 1, 2005
1.654K
+104.119
6.72%
jan 1, 2006
1.836K
+181.739
10.99%
jan 1, 2007
1.976K
+140.43
7.65%
jan 1, 2008
2.167K
+190.61
9.65%
jan 1, 2009
2.434K
+267.184
12.33%
jan 1, 2010
2.28K
-154.151
-6.33%
jan 1, 2011
2.394K
+114.1
5.01%
jan 1, 2012
2.713K
+319.563
13.35%
jan 1, 2013
2.864K
+150.594
5.55%
jan 1, 2014
3.009K
+145.299
5.07%
jan 1, 2015
3.158K
+148.974
4.95%
Ranking of countries by current statistics by years


Comments: