29
/
en
AIzaSyAYiBZKx7MnpbEhh9jyipgxe19OcubqV5w
April 1, 2024
267582
Tunisia
TUN
true
2
1
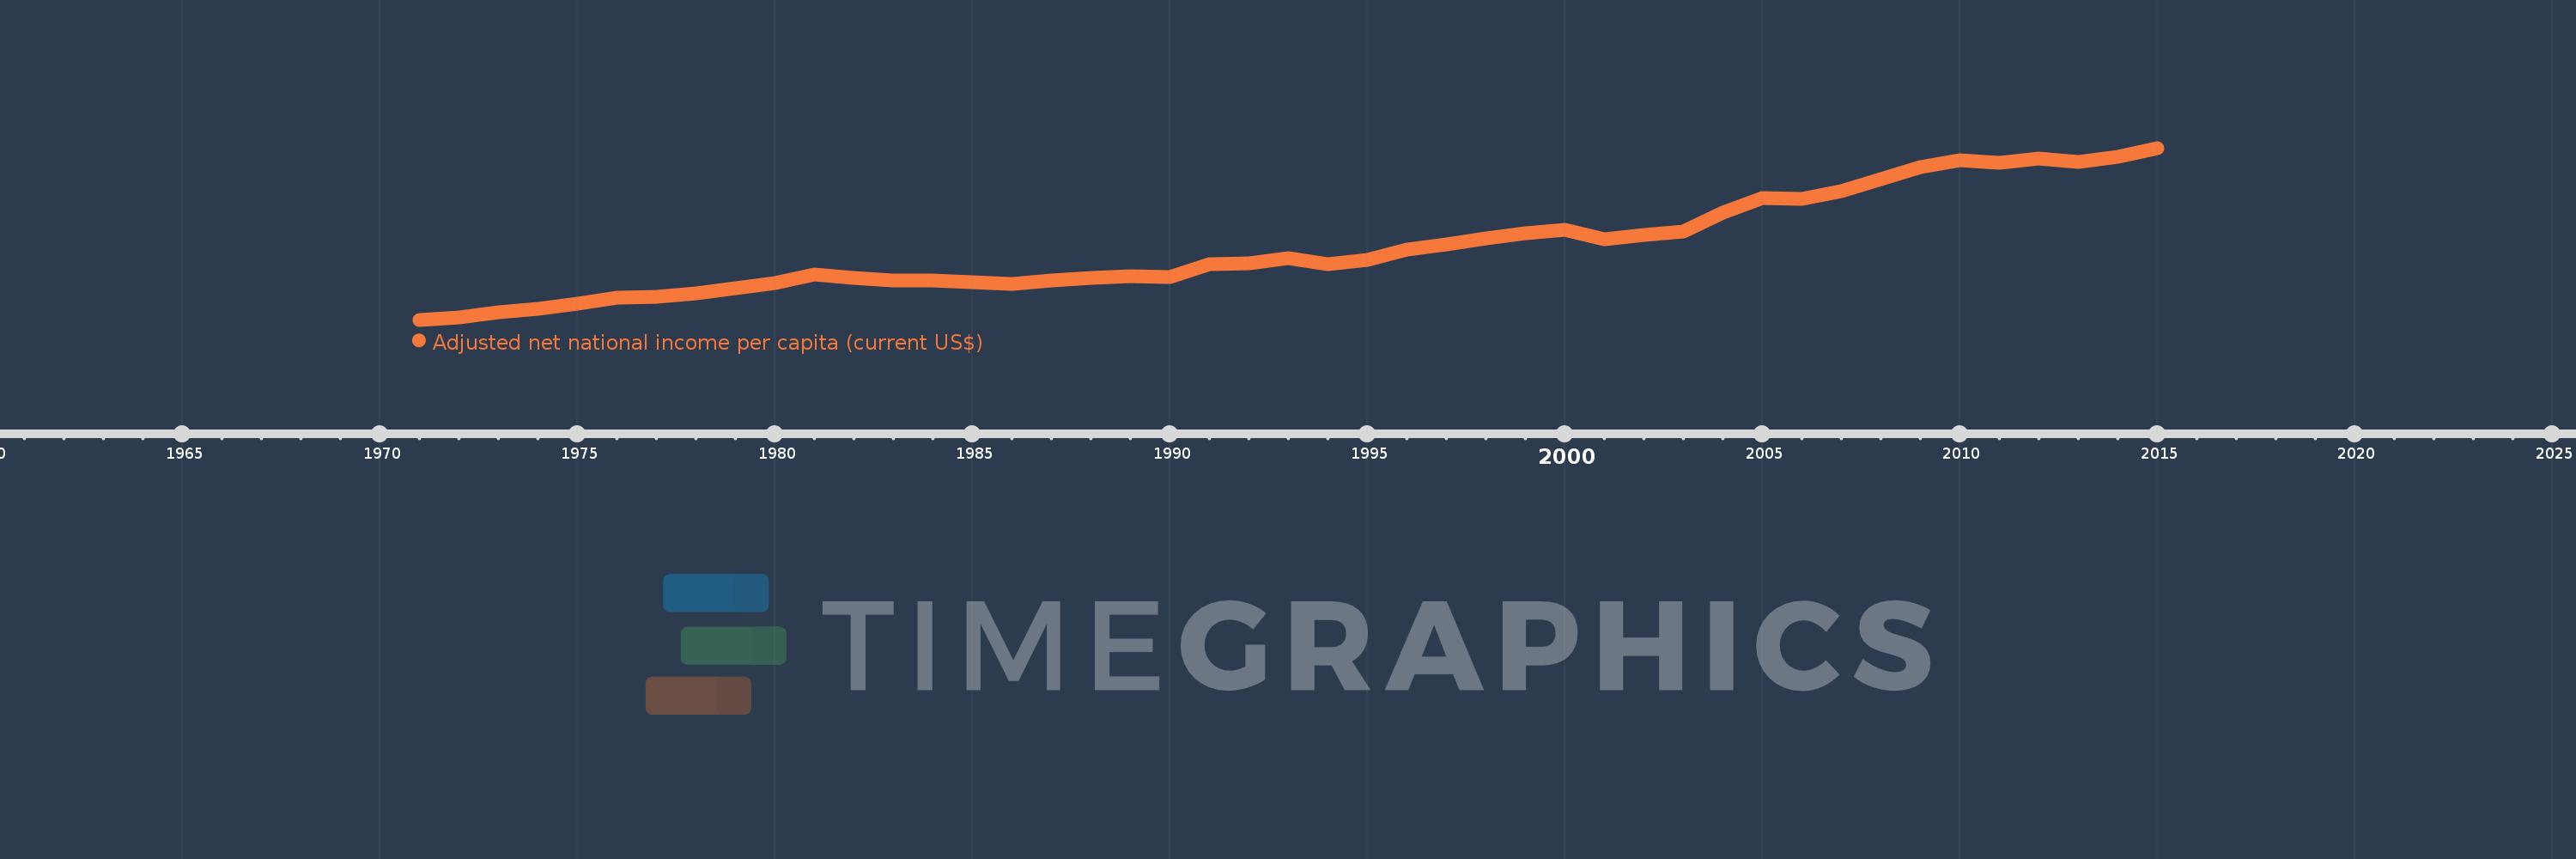
Adjusted net national income per capita (current US$)
2015,2014,2013,2012,2011,2010,2009,2008,2007,2006,2005,2004,2003,2002,2001,2000,1999,1998,1997,1996,1995,1994,1993,1992,1991,1990,1989,1988,1987,1986,1985,1984,1983,1982,1981,1980,1979,1978,1977,1976,1975,1974,1973,1972,1971
This statistics in other country:
AfghanistanAlbaniaAlgeriaAngolaArab WorldArgentinaArmeniaAustraliaAustriaAzerbaijanBahamas, TheBahrainBangladeshBarbadosBelarusBelgiumBelizeBeninBhutanBoliviaBotswanaBrazilBrunei DarussalamBulgariaBurkina FasoBurundiCabo VerdeCambodiaCameroonCanadaCaribbean small statesCentral African RepublicCentral Europe and the BalticsChadChileChinaColombiaComorosCongo, Dem. Rep.Congo, Rep.Costa RicaCote d'IvoireCroatiaCubaCyprusCzech RepublicDenmarkDjiboutiDominicaDominican RepublicEarly-demographic dividendEast Asia & PacificEast Asia & Pacific (excluding high income)East Asia & Pacific (IDA & IBRD countries)EcuadorEgypt, Arab Rep.El SalvadorEquatorial GuineaEritreaEstoniaEthiopiaEuro areaEurope & Central AsiaEurope & Central Asia (excluding high income)Europe & Central Asia (IDA & IBRD countries)European UnionFijiFinlandFragile and conflict affected situationsFranceGabonGambia, TheGeorgiaGermanyGhanaGreeceGuatemalaGuineaGuinea-BissauGuyanaHaitiHeavily indebted poor countries (HIPC)High incomeHondurasHong Kong SAR, ChinaHungaryIBRD onlyIcelandIDA & IBRD totalIDA blendIDA onlyIDA totalIndiaIndonesiaIran, Islamic Rep.IraqIrelandIsraelItalyJamaicaJapanJordanKazakhstanKenyaKiribatiKorea, Rep.KuwaitKyrgyz RepublicLao PDRLate-demographic dividendLatin America & Caribbean Latin America & Caribbean (excluding high income)Latin America & the Caribbean (IDA & IBRD countries)LatviaLeast developed countries: UN classificationLebanonLesothoLiberiaLibyaLithuaniaLow & middle incomeLow incomeLower middle incomeLuxembourgMacedonia, FYRMadagascarMalawiMalaysiaMaldivesMaliMauritaniaMauritiusMexicoMiddle East & North AfricaMiddle East & North Africa (excluding high income)Middle East & North Africa (IDA & IBRD countries)Middle incomeMoldovaMongoliaMoroccoMozambiqueMyanmarNamibiaNepalNetherlandsNew ZealandNicaraguaNigerNigeriaNorth AmericaNorwayOECD membersOmanOther small statesPacific island small statesPakistanPanamaPapua New GuineaParaguayPeruPhilippinesPolandPortugalPost-demographic dividendPre-demographic dividendQatarRomaniaRussian FederationRwandaSamoaSao Tome and PrincipeSaudi ArabiaSenegalSeychellesSierra LeoneSingaporeSlovak RepublicSloveniaSmall statesSolomon IslandsSouth AfricaSouth AsiaSouth Asia (IDA & IBRD)SpainSri LankaSt. LuciaSt. Vincent and the GrenadinesSub-Saharan Africa Sub-Saharan Africa (excluding high income)Sub-Saharan Africa (IDA & IBRD countries)SudanSurinameSwazilandSwedenSwitzerlandSyrian Arab RepublicTajikistanTanzaniaThailandTogoTongaTrinidad and TobagoTunisiaTurkeyTurkmenistanUgandaUkraineUnited Arab EmiratesUnited KingdomUnited StatesUpper middle incomeUruguayUzbekistanVanuatuVenezuela, RBVietnamWorldYemen, Rep.ZambiaZimbabwe Timeline:
This timeline shows a graph from 1971 to 2015 of Tunisia. No data until 1970. Number of actual observations by date: 45.
Source name:
World Development Indicators
Source organization:
World Bank staff estimates based on sources and methods in World Bank's "The Changing Wealth of Nations: Measuring Sustainable Development in the New Millennium" (2011).
Categories, topics:
Economy & Growth
Last updated:
apr 23, 2017
Indicators value changes by year
Minimum:
247.068
jan 1, 1971
At the date of observation
Value
Absolute change
Change from previous value
jan 1, 1971
247.068
+247.068
0.0%
jan 1, 1972
287.277
+40.209
16.27%
jan 1, 1973
377.305
+90.028
31.34%
jan 1, 1974
443.062
+65.757
17.43%
jan 1, 1975
539.927
+96.865
21.86%
jan 1, 1976
651.841
+111.914
20.73%
jan 1, 1977
659.436
+7.595
1.17%
jan 1, 1978
726.64
+67.203
10.19%
jan 1, 1979
825.415
+98.775
13.59%
jan 1, 1980
910.729
+85.314
10.34%
jan 1, 1981
1.078K
+167.506
18.39%
jan 1, 1982
1.015K
-63.428
-5.88%
jan 1, 1983
957.883
-56.924
-5.61%
jan 1, 1984
966.531
+8.648
0.9%
jan 1, 1985
928.118
-38.413
-3.97%
jan 1, 1986
909.066
-19.052
-2.05%
jan 1, 1987
967.965
+58.898
6.48%
jan 1, 1988
1.008K
+40.509
4.18%
jan 1, 1989
1.047K
+38.524
3.82%
jan 1, 1990
1.035K
-12.293
-1.17%
jan 1, 1991
1.259K
+224.52
21.7%
jan 1, 1992
1.276K
+16.329
1.3%
jan 1, 1993
1.369K
+93.683
7.34%
jan 1, 1994
1.261K
-108.508
-7.92%
jan 1, 1995
1.336K
+74.95
5.94%
jan 1, 1996
1.535K
+199.429
14.93%
jan 1, 1997
1.63K
+95.343
6.21%
jan 1, 1998
1.734K
+103.824
6.37%
jan 1, 1999
1.822K
+88.205
5.09%
jan 1, 2000
1.896K
+73.766
4.05%
jan 1, 2001
1.727K
-169.174
-8.92%
jan 1, 2002
1.796K
+68.914
3.99%
jan 1, 2003
1.858K
+62.123
3.46%
jan 1, 2004
2.202K
+343.469
18.48%
jan 1, 2005
2.468K
+266.099
12.09%
jan 1, 2006
2.456K
-11.477
-0.47%
jan 1, 2007
2.601K
+144.593
5.89%
jan 1, 2008
2.827K
+225.972
8.69%
jan 1, 2009
3.04K
+213.415
7.55%
jan 1, 2010
3.163K
+122.977
4.05%
jan 1, 2011
3.117K
-46.126
-1.46%
jan 1, 2012
3.191K
+73.66
2.36%
jan 1, 2013
3.127K
-64.042
-2.01%
jan 1, 2014
3.232K
+105.471
3.37%
jan 1, 2015
3.39K
+158.012
4.89%
Ranking of countries by current statistics by years


Comments: