29
/
en
AIzaSyAYiBZKx7MnpbEhh9jyipgxe19OcubqV5w
April 1, 2024
108200
Comoros
COM
true
2
1
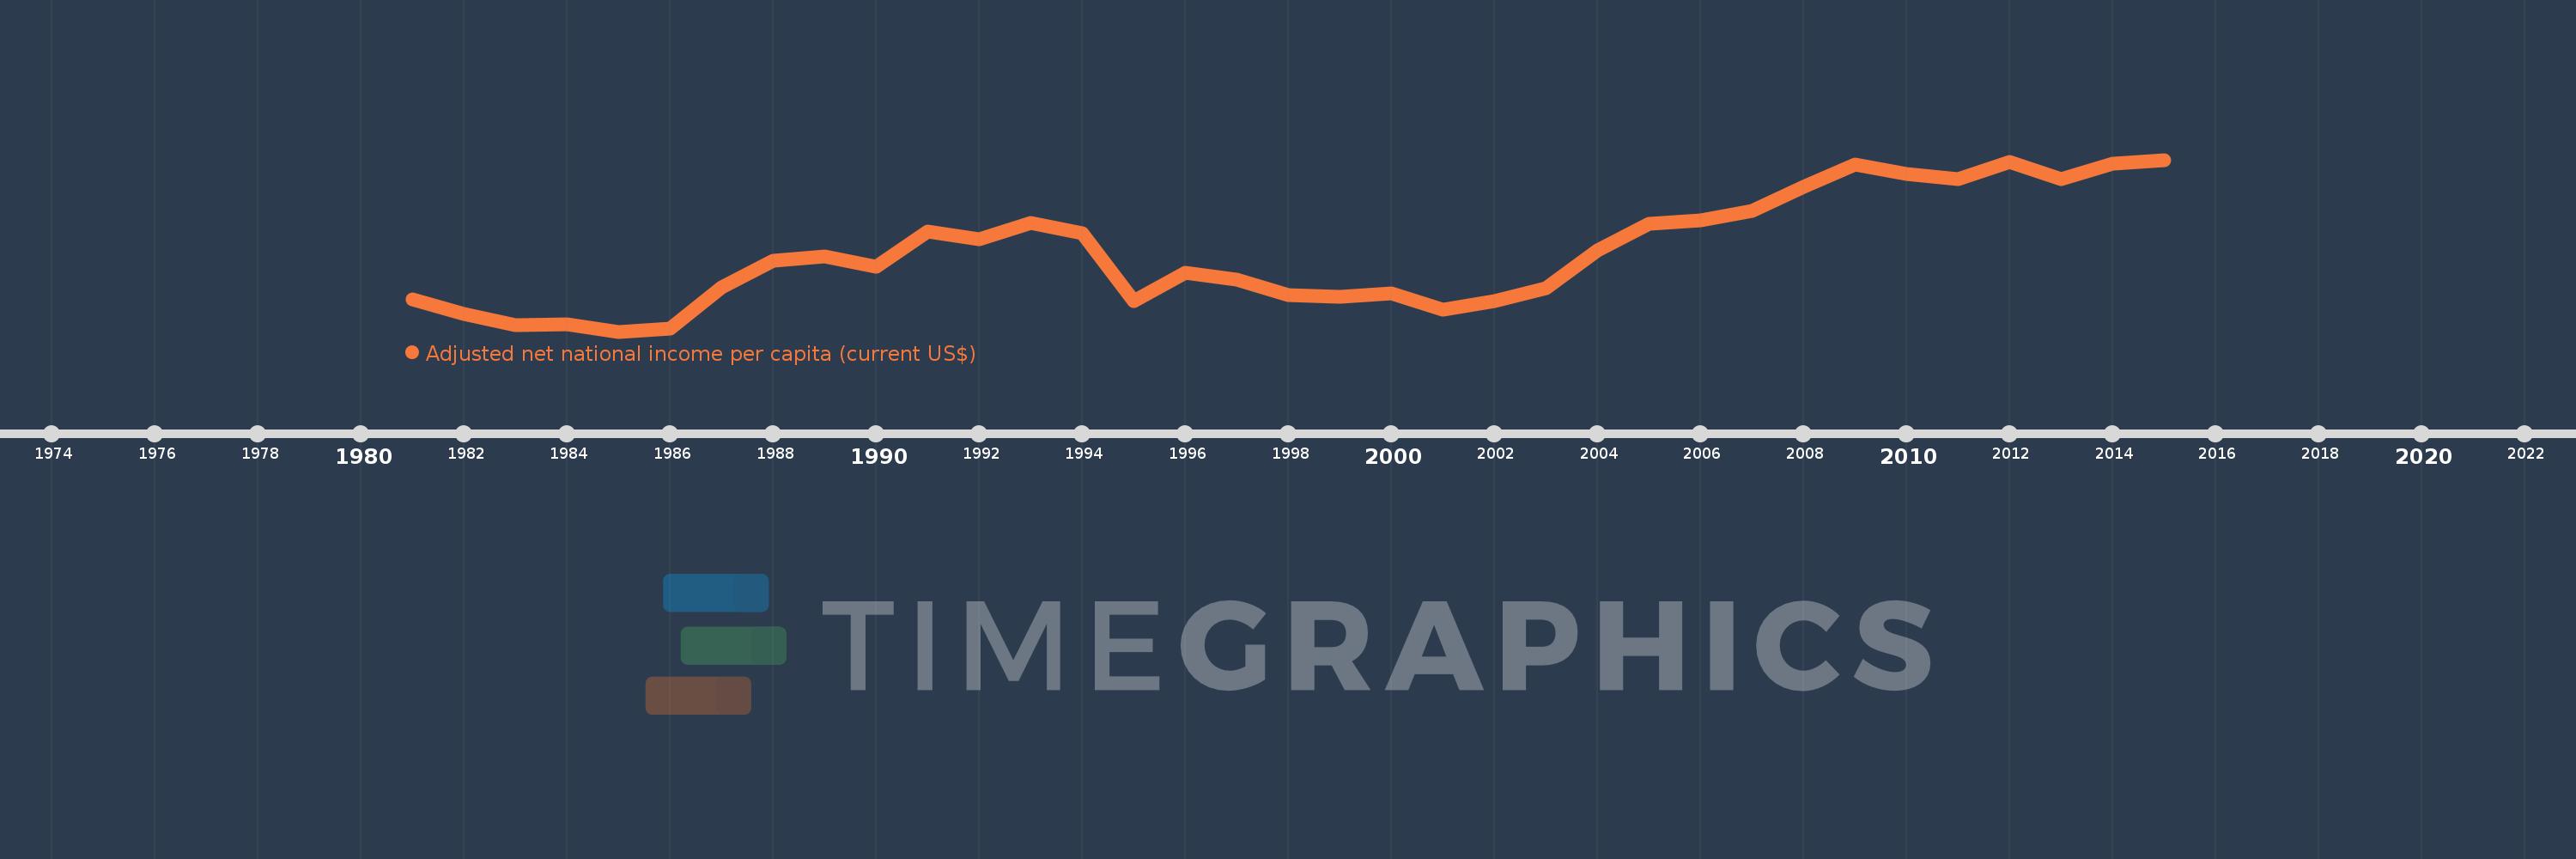
Adjusted net national income per capita (current US$)
2015,2014,2013,2012,2011,2010,2009,2008,2007,2006,2005,2004,2003,2002,2001,2000,1999,1998,1997,1996,1995,1994,1993,1992,1991,1990,1989,1988,1987,1986,1985,1984,1983,1982,1981
This statistics in other country:
AfghanistanAlbaniaAlgeriaAngolaArab WorldArgentinaArmeniaAustraliaAustriaAzerbaijanBahamas, TheBahrainBangladeshBarbadosBelarusBelgiumBelizeBeninBhutanBoliviaBotswanaBrazilBrunei DarussalamBulgariaBurkina FasoBurundiCabo VerdeCambodiaCameroonCanadaCaribbean small statesCentral African RepublicCentral Europe and the BalticsChadChileChinaColombiaComorosCongo, Dem. Rep.Congo, Rep.Costa RicaCote d'IvoireCroatiaCubaCyprusCzech RepublicDenmarkDjiboutiDominicaDominican RepublicEarly-demographic dividendEast Asia & PacificEast Asia & Pacific (excluding high income)East Asia & Pacific (IDA & IBRD countries)EcuadorEgypt, Arab Rep.El SalvadorEquatorial GuineaEritreaEstoniaEthiopiaEuro areaEurope & Central AsiaEurope & Central Asia (excluding high income)Europe & Central Asia (IDA & IBRD countries)European UnionFijiFinlandFragile and conflict affected situationsFranceGabonGambia, TheGeorgiaGermanyGhanaGreeceGuatemalaGuineaGuinea-BissauGuyanaHaitiHeavily indebted poor countries (HIPC)High incomeHondurasHong Kong SAR, ChinaHungaryIBRD onlyIcelandIDA & IBRD totalIDA blendIDA onlyIDA totalIndiaIndonesiaIran, Islamic Rep.IraqIrelandIsraelItalyJamaicaJapanJordanKazakhstanKenyaKiribatiKorea, Rep.KuwaitKyrgyz RepublicLao PDRLate-demographic dividendLatin America & Caribbean Latin America & Caribbean (excluding high income)Latin America & the Caribbean (IDA & IBRD countries)LatviaLeast developed countries: UN classificationLebanonLesothoLiberiaLibyaLithuaniaLow & middle incomeLow incomeLower middle incomeLuxembourgMacedonia, FYRMadagascarMalawiMalaysiaMaldivesMaliMauritaniaMauritiusMexicoMiddle East & North AfricaMiddle East & North Africa (excluding high income)Middle East & North Africa (IDA & IBRD countries)Middle incomeMoldovaMongoliaMoroccoMozambiqueMyanmarNamibiaNepalNetherlandsNew ZealandNicaraguaNigerNigeriaNorth AmericaNorwayOECD membersOmanOther small statesPacific island small statesPakistanPanamaPapua New GuineaParaguayPeruPhilippinesPolandPortugalPost-demographic dividendPre-demographic dividendQatarRomaniaRussian FederationRwandaSamoaSao Tome and PrincipeSaudi ArabiaSenegalSeychellesSierra LeoneSingaporeSlovak RepublicSloveniaSmall statesSolomon IslandsSouth AfricaSouth AsiaSouth Asia (IDA & IBRD)SpainSri LankaSt. LuciaSt. Vincent and the GrenadinesSub-Saharan Africa Sub-Saharan Africa (excluding high income)Sub-Saharan Africa (IDA & IBRD countries)SudanSurinameSwazilandSwedenSwitzerlandSyrian Arab RepublicTajikistanTanzaniaThailandTogoTongaTrinidad and TobagoTunisiaTurkeyTurkmenistanUgandaUkraineUnited Arab EmiratesUnited KingdomUnited StatesUpper middle incomeUruguayUzbekistanVanuatuVenezuela, RBVietnamWorldYemen, Rep.ZambiaZimbabwe Timeline:
This timeline shows a graph from 1981 to 2015 of Comoros. No data until 1980. Number of actual observations by date: 35.
Source name:
World Development Indicators
Source organization:
World Bank staff estimates based on sources and methods in World Bank's "The Changing Wealth of Nations: Measuring Sustainable Development in the New Millennium" (2011).
Categories, topics:
Economy & Growth
Last updated:
apr 23, 2017
Indicators value changes by year
Minimum:
260.811
jan 1, 1985
Maximum:
679.341
jan 1, 2015
At the date of observation
Value
Absolute change
Change from previous value
jan 1, 1981
339.355
+339.355
0.0%
jan 1, 1982
303.123
-36.233
-10.68%
jan 1, 1983
275.789
-27.334
-9.02%
jan 1, 1984
278.394
+2.605
0.94%
jan 1, 1985
260.811
-17.583
-6.32%
jan 1, 1986
268.344
+7.533
2.89%
jan 1, 1987
367.676
+99.332
37.02%
jan 1, 1988
434.392
+66.716
18.15%
jan 1, 1989
443.593
+9.201
2.12%
jan 1, 1990
418.263
-25.329
-5.71%
jan 1, 1991
503.64
+85.376
20.41%
jan 1, 1992
485.515
-18.124
-3.6%
jan 1, 1993
525.169
+39.654
8.17%
jan 1, 1994
500.757
-24.412
-4.65%
jan 1, 1995
335.226
-165.531
-33.06%
jan 1, 1996
403.64
+68.414
20.41%
jan 1, 1997
387.795
-15.845
-3.93%
jan 1, 1998
349.149
-38.646
-9.97%
jan 1, 1999
344.994
-4.155
-1.19%
jan 1, 2000
353.015
+8.021
2.32%
jan 1, 2001
314.777
-38.238
-10.83%
jan 1, 2002
335.726
+20.949
6.66%
jan 1, 2003
366.746
+31.02
9.24%
jan 1, 2004
459.251
+92.505
25.22%
jan 1, 2005
523.754
+64.503
14.05%
jan 1, 2006
532.254
+8.499
1.62%
jan 1, 2007
555.592
+23.339
4.38%
jan 1, 2008
613.904
+58.311
10.5%
jan 1, 2009
668.07
+54.166
8.82%
jan 1, 2010
644.658
-23.412
-3.5%
jan 1, 2011
633.264
-11.395
-1.77%
jan 1, 2012
673.368
+40.105
6.33%
jan 1, 2013
632.405
-40.964
-6.08%
jan 1, 2014
670.364
+37.959
6.0%
jan 1, 2015
679.341
+8.977
1.34%
Ranking of countries by current statistics by years


Comments: