29
/
en
AIzaSyAYiBZKx7MnpbEhh9jyipgxe19OcubqV5w
April 1, 2024
75895
Bahamas, The
BHS
true
2
1
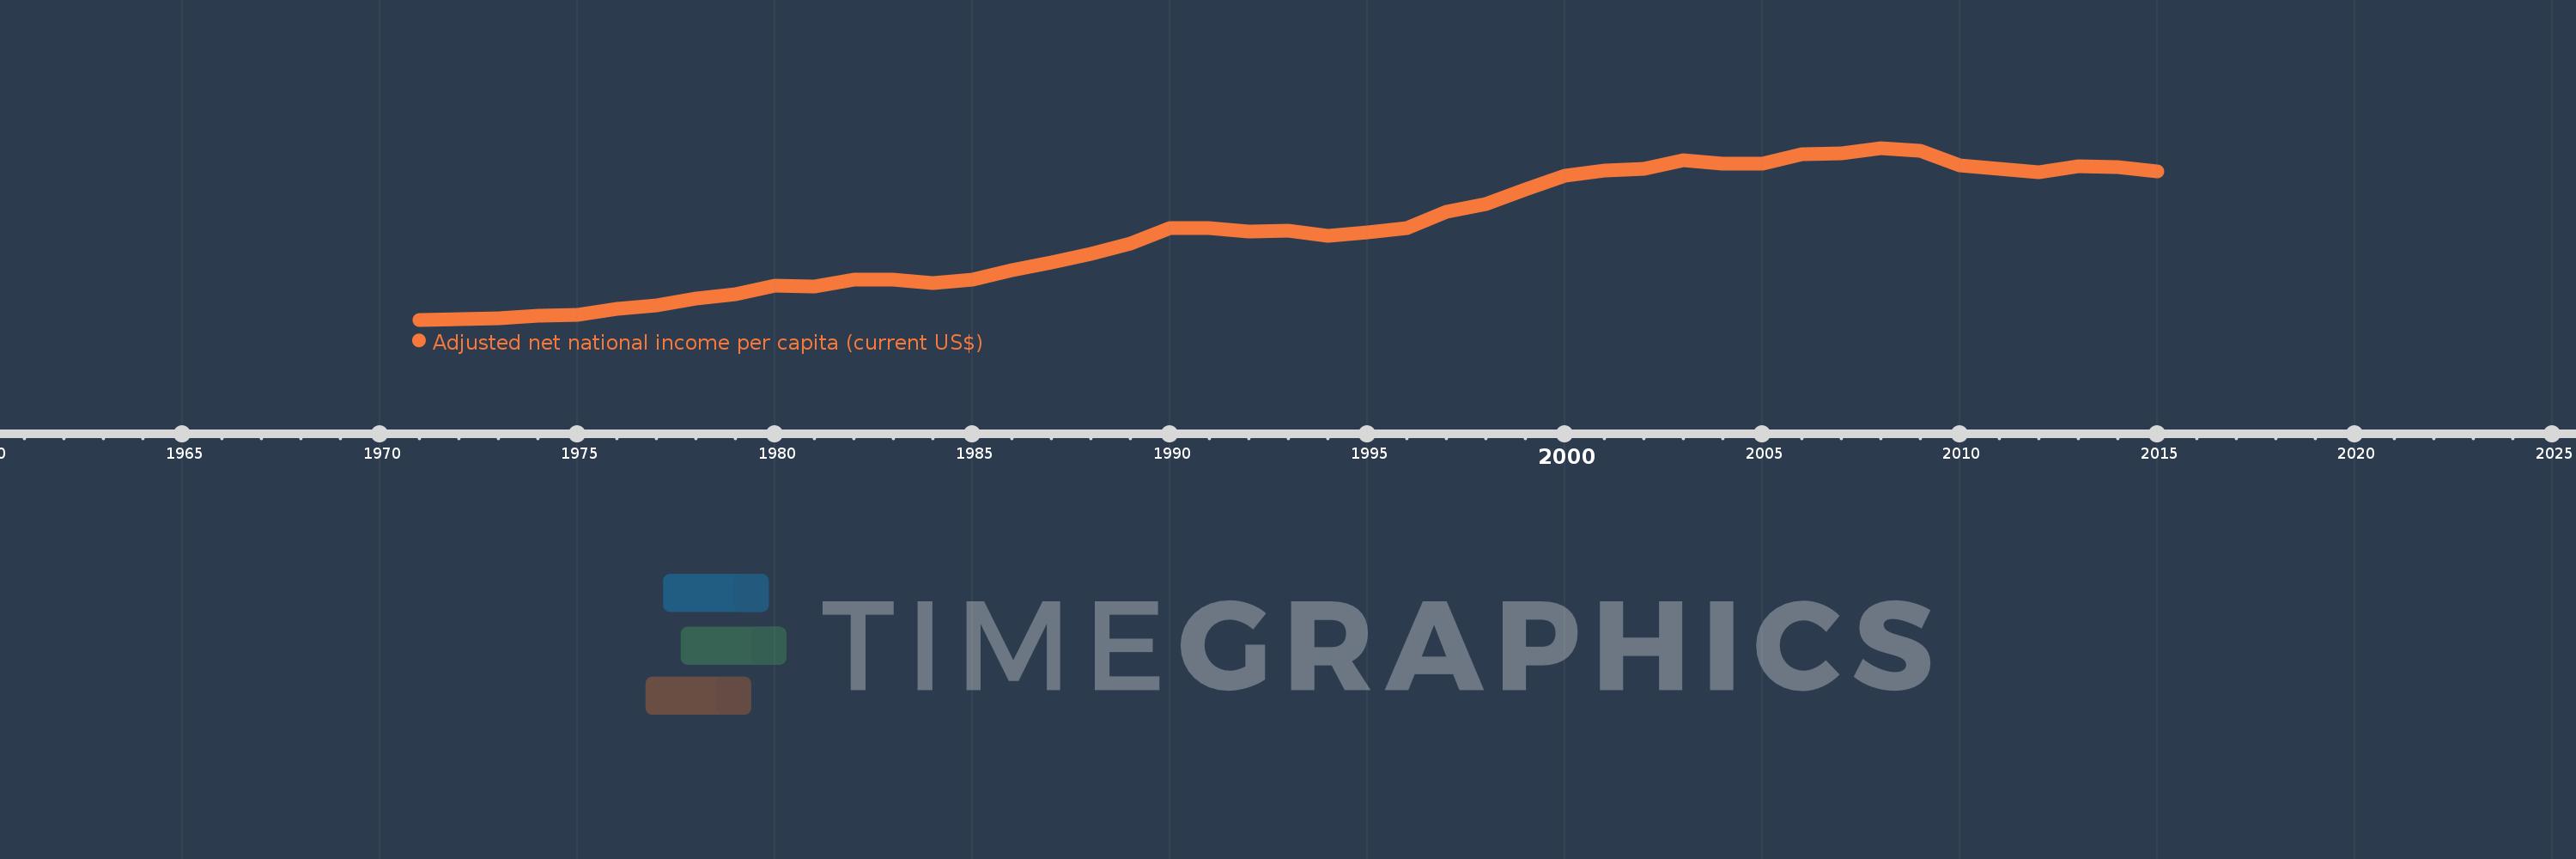
Adjusted net national income per capita (current US$)
2015,2014,2013,2012,2011,2010,2009,2008,2007,2006,2005,2004,2003,2002,2001,2000,1999,1998,1997,1996,1995,1994,1993,1992,1991,1990,1989,1988,1987,1986,1985,1984,1983,1982,1981,1980,1979,1978,1977,1976,1975,1974,1973,1972,1971
This statistics in other country:
AfghanistanAlbaniaAlgeriaAngolaArab WorldArgentinaArmeniaAustraliaAustriaAzerbaijanBahamas, TheBahrainBangladeshBarbadosBelarusBelgiumBelizeBeninBhutanBoliviaBotswanaBrazilBrunei DarussalamBulgariaBurkina FasoBurundiCabo VerdeCambodiaCameroonCanadaCaribbean small statesCentral African RepublicCentral Europe and the BalticsChadChileChinaColombiaComorosCongo, Dem. Rep.Congo, Rep.Costa RicaCote d'IvoireCroatiaCubaCyprusCzech RepublicDenmarkDjiboutiDominicaDominican RepublicEarly-demographic dividendEast Asia & PacificEast Asia & Pacific (excluding high income)East Asia & Pacific (IDA & IBRD countries)EcuadorEgypt, Arab Rep.El SalvadorEquatorial GuineaEritreaEstoniaEthiopiaEuro areaEurope & Central AsiaEurope & Central Asia (excluding high income)Europe & Central Asia (IDA & IBRD countries)European UnionFijiFinlandFragile and conflict affected situationsFranceGabonGambia, TheGeorgiaGermanyGhanaGreeceGuatemalaGuineaGuinea-BissauGuyanaHaitiHeavily indebted poor countries (HIPC)High incomeHondurasHong Kong SAR, ChinaHungaryIBRD onlyIcelandIDA & IBRD totalIDA blendIDA onlyIDA totalIndiaIndonesiaIran, Islamic Rep.IraqIrelandIsraelItalyJamaicaJapanJordanKazakhstanKenyaKiribatiKorea, Rep.KuwaitKyrgyz RepublicLao PDRLate-demographic dividendLatin America & Caribbean Latin America & Caribbean (excluding high income)Latin America & the Caribbean (IDA & IBRD countries)LatviaLeast developed countries: UN classificationLebanonLesothoLiberiaLibyaLithuaniaLow & middle incomeLow incomeLower middle incomeLuxembourgMacedonia, FYRMadagascarMalawiMalaysiaMaldivesMaliMauritaniaMauritiusMexicoMiddle East & North AfricaMiddle East & North Africa (excluding high income)Middle East & North Africa (IDA & IBRD countries)Middle incomeMoldovaMongoliaMoroccoMozambiqueMyanmarNamibiaNepalNetherlandsNew ZealandNicaraguaNigerNigeriaNorth AmericaNorwayOECD membersOmanOther small statesPacific island small statesPakistanPanamaPapua New GuineaParaguayPeruPhilippinesPolandPortugalPost-demographic dividendPre-demographic dividendQatarRomaniaRussian FederationRwandaSamoaSao Tome and PrincipeSaudi ArabiaSenegalSeychellesSierra LeoneSingaporeSlovak RepublicSloveniaSmall statesSolomon IslandsSouth AfricaSouth AsiaSouth Asia (IDA & IBRD)SpainSri LankaSt. LuciaSt. Vincent and the GrenadinesSub-Saharan Africa Sub-Saharan Africa (excluding high income)Sub-Saharan Africa (IDA & IBRD countries)SudanSurinameSwazilandSwedenSwitzerlandSyrian Arab RepublicTajikistanTanzaniaThailandTogoTongaTrinidad and TobagoTunisiaTurkeyTurkmenistanUgandaUkraineUnited Arab EmiratesUnited KingdomUnited StatesUpper middle incomeUruguayUzbekistanVanuatuVenezuela, RBVietnamWorldYemen, Rep.ZambiaZimbabwe Timeline:
This timeline shows a graph from 1971 to 2015 of Bahamas, The. No data until 1970. Number of actual observations by date: 45.
Source name:
World Development Indicators
Source organization:
World Bank staff estimates based on sources and methods in World Bank's "The Changing Wealth of Nations: Measuring Sustainable Development in the New Millennium" (2011).
Categories, topics:
Economy & Growth
Last updated:
apr 23, 2017
Indicators value changes by year
Minimum:
2.876K
jan 1, 1971
Maximum:
22.008K
jan 1, 2008
At the date of observation
Value
Absolute change
Change from previous value
jan 1, 1971
2.876K
+2.876K
0.0%
jan 1, 1972
2.984K
+108.17
3.76%
jan 1, 1973
2.991K
+7.041
0.24%
jan 1, 1974
3.329K
+337.805
11.29%
jan 1, 1975
3.384K
+54.754
1.64%
jan 1, 1976
4.125K
+741.261
21.91%
jan 1, 1977
4.429K
+303.787
7.36%
jan 1, 1978
5.226K
+797.391
18.0%
jan 1, 1979
5.73K
+503.882
9.64%
jan 1, 1980
6.699K
+969.387
16.92%
jan 1, 1981
6.596K
-103.134
-1.54%
jan 1, 1982
7.328K
+731.95
11.1%
jan 1, 1983
7.333K
+5.181
0.07%
jan 1, 1984
6.97K
-363.446
-4.96%
jan 1, 1985
7.318K
+348.394
5.0%
jan 1, 1986
8.359K
+1.041K
14.22%
jan 1, 1987
9.287K
+928.184
11.1%
jan 1, 1988
10.218K
+930.867
10.02%
jan 1, 1989
11.38K
+1.162K
11.37%
jan 1, 1990
13.098K
+1.719K
15.1%
jan 1, 1991
13.112K
+13.191
0.1%
jan 1, 1992
12.729K
-382.644
-2.92%
jan 1, 1993
12.783K
+54.399
0.43%
jan 1, 1994
12.248K
-534.914
-4.18%
jan 1, 1995
12.589K
+340.69
2.78%
jan 1, 1996
13.113K
+523.75
4.16%
jan 1, 1997
14.92K
+1.807K
13.78%
jan 1, 1998
15.741K
+821.013
5.5%
jan 1, 1999
17.393K
+1.652K
10.5%
jan 1, 2000
18.963K
+1.57K
9.03%
jan 1, 2001
19.489K
+526.175
2.77%
jan 1, 2002
19.705K
+215.667
1.11%
jan 1, 2003
20.636K
+931.309
4.73%
jan 1, 2004
20.253K
-383.895
-1.86%
jan 1, 2005
20.238K
-14.454
-0.07%
jan 1, 2006
21.328K
+1.09K
5.39%
jan 1, 2007
21.431K
+102.881
0.48%
jan 1, 2008
22.008K
+577.177
2.69%
jan 1, 2009
21.736K
-272.345
-1.24%
jan 1, 2010
20.036K
-1.699K
-7.82%
jan 1, 2011
19.693K
-343.563
-1.71%
jan 1, 2012
19.339K
-354.032
-1.8%
jan 1, 2013
19.941K
+601.969
3.11%
jan 1, 2014
19.905K
-35.92
-0.18%
jan 1, 2015
19.438K
-467.261
-2.35%
Ranking of countries by current statistics by years


Comments: