29
/
en
AIzaSyAYiBZKx7MnpbEhh9jyipgxe19OcubqV5w
April 1, 2024
149916
Honduras
HND
true
2
1
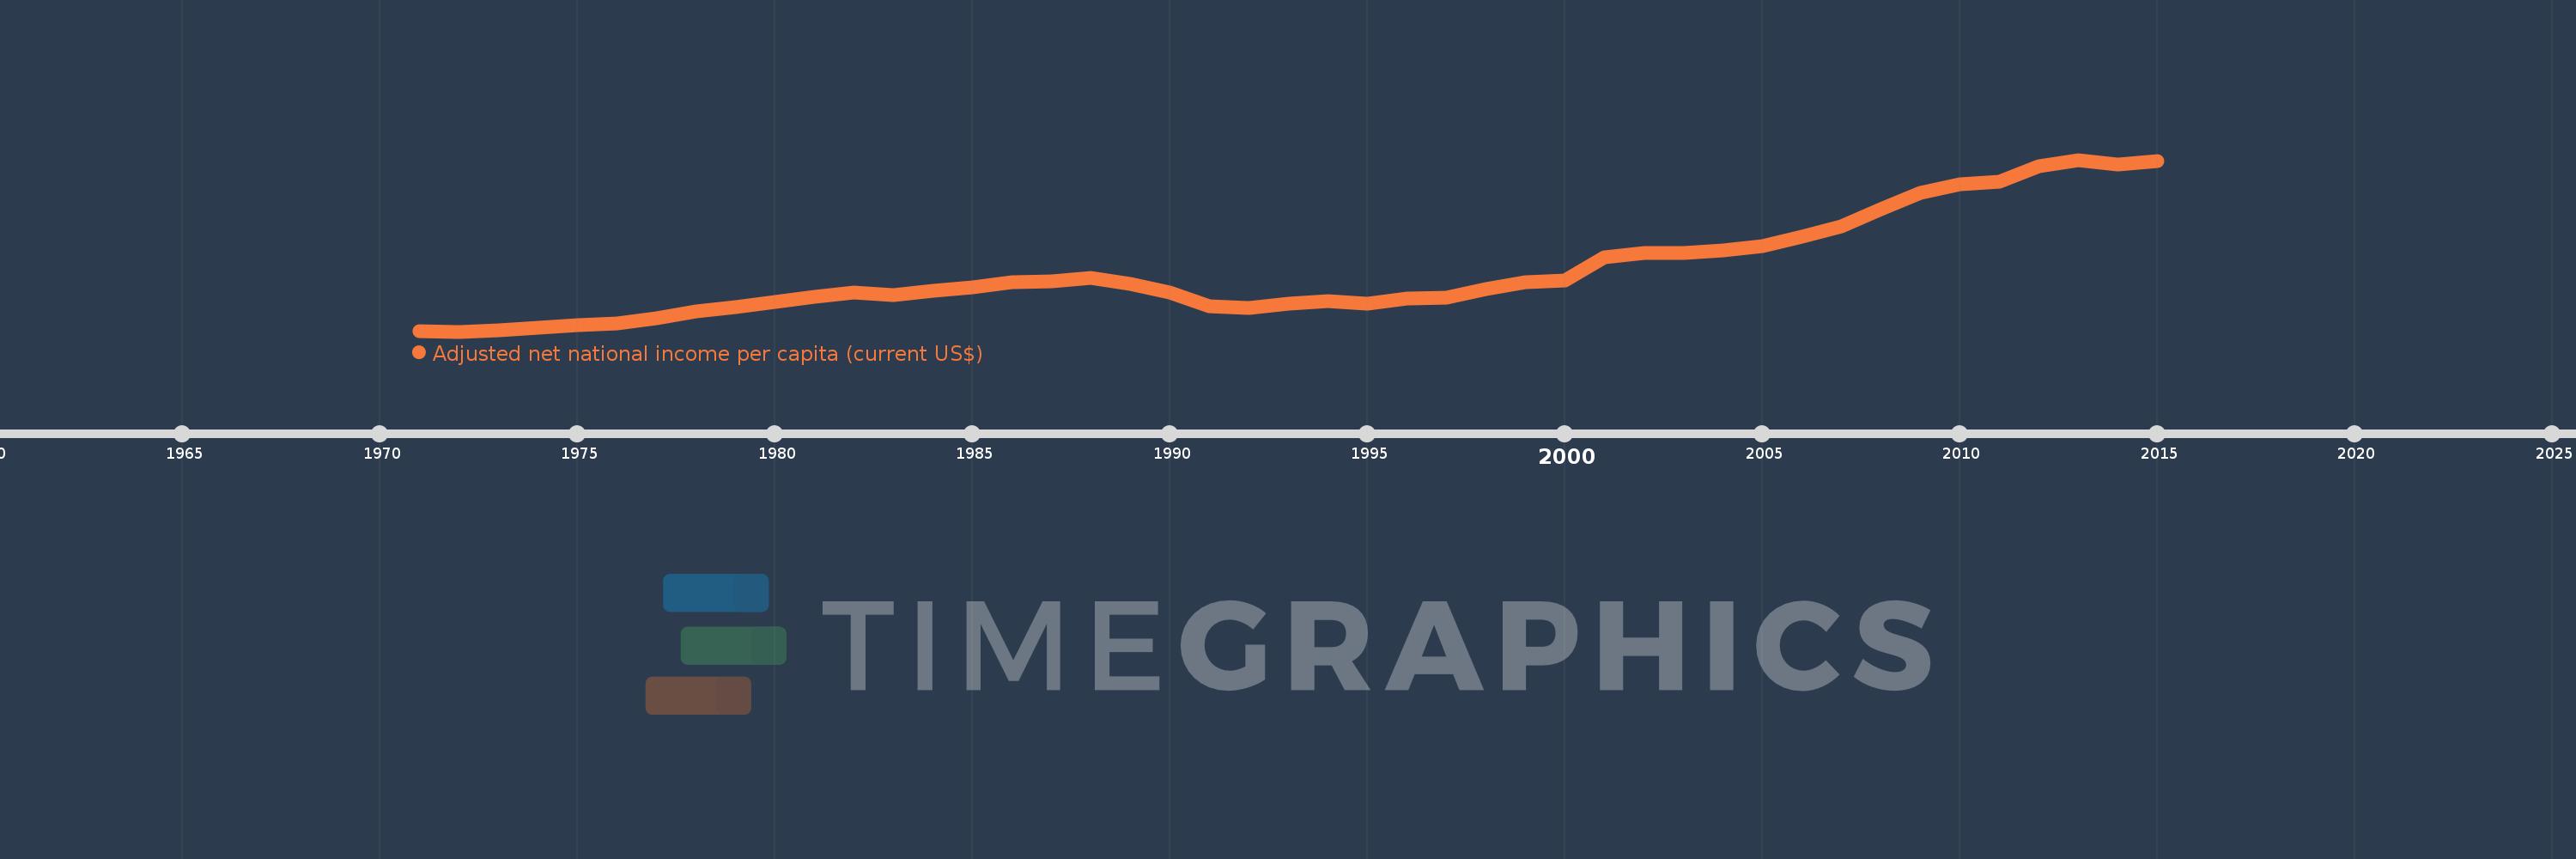
Adjusted net national income per capita (current US$)
2015,2014,2013,2012,2011,2010,2009,2008,2007,2006,2005,2004,2003,2002,2001,2000,1999,1998,1997,1996,1995,1994,1993,1992,1991,1990,1989,1988,1987,1986,1985,1984,1983,1982,1981,1980,1979,1978,1977,1976,1975,1974,1973,1972,1971
This statistics in other country:
AfghanistanAlbaniaAlgeriaAngolaArab WorldArgentinaArmeniaAustraliaAustriaAzerbaijanBahamas, TheBahrainBangladeshBarbadosBelarusBelgiumBelizeBeninBhutanBoliviaBotswanaBrazilBrunei DarussalamBulgariaBurkina FasoBurundiCabo VerdeCambodiaCameroonCanadaCaribbean small statesCentral African RepublicCentral Europe and the BalticsChadChileChinaColombiaComorosCongo, Dem. Rep.Congo, Rep.Costa RicaCote d'IvoireCroatiaCubaCyprusCzech RepublicDenmarkDjiboutiDominicaDominican RepublicEarly-demographic dividendEast Asia & PacificEast Asia & Pacific (excluding high income)East Asia & Pacific (IDA & IBRD countries)EcuadorEgypt, Arab Rep.El SalvadorEquatorial GuineaEritreaEstoniaEthiopiaEuro areaEurope & Central AsiaEurope & Central Asia (excluding high income)Europe & Central Asia (IDA & IBRD countries)European UnionFijiFinlandFragile and conflict affected situationsFranceGabonGambia, TheGeorgiaGermanyGhanaGreeceGuatemalaGuineaGuinea-BissauGuyanaHaitiHeavily indebted poor countries (HIPC)High incomeHondurasHong Kong SAR, ChinaHungaryIBRD onlyIcelandIDA & IBRD totalIDA blendIDA onlyIDA totalIndiaIndonesiaIran, Islamic Rep.IraqIrelandIsraelItalyJamaicaJapanJordanKazakhstanKenyaKiribatiKorea, Rep.KuwaitKyrgyz RepublicLao PDRLate-demographic dividendLatin America & Caribbean Latin America & Caribbean (excluding high income)Latin America & the Caribbean (IDA & IBRD countries)LatviaLeast developed countries: UN classificationLebanonLesothoLiberiaLibyaLithuaniaLow & middle incomeLow incomeLower middle incomeLuxembourgMacedonia, FYRMadagascarMalawiMalaysiaMaldivesMaliMauritaniaMauritiusMexicoMiddle East & North AfricaMiddle East & North Africa (excluding high income)Middle East & North Africa (IDA & IBRD countries)Middle incomeMoldovaMongoliaMoroccoMozambiqueMyanmarNamibiaNepalNetherlandsNew ZealandNicaraguaNigerNigeriaNorth AmericaNorwayOECD membersOmanOther small statesPacific island small statesPakistanPanamaPapua New GuineaParaguayPeruPhilippinesPolandPortugalPost-demographic dividendPre-demographic dividendQatarRomaniaRussian FederationRwandaSamoaSao Tome and PrincipeSaudi ArabiaSenegalSeychellesSierra LeoneSingaporeSlovak RepublicSloveniaSmall statesSolomon IslandsSouth AfricaSouth AsiaSouth Asia (IDA & IBRD)SpainSri LankaSt. LuciaSt. Vincent and the GrenadinesSub-Saharan Africa Sub-Saharan Africa (excluding high income)Sub-Saharan Africa (IDA & IBRD countries)SudanSurinameSwazilandSwedenSwitzerlandSyrian Arab RepublicTajikistanTanzaniaThailandTogoTongaTrinidad and TobagoTunisiaTurkeyTurkmenistanUgandaUkraineUnited Arab EmiratesUnited KingdomUnited StatesUpper middle incomeUruguayUzbekistanVanuatuVenezuela, RBVietnamWorldYemen, Rep.ZambiaZimbabwe Timeline:
This timeline shows a graph from 1971 to 2015 of Honduras. No data until 1970. Number of actual observations by date: 45.
Source name:
World Development Indicators
Source organization:
World Bank staff estimates based on sources and methods in World Bank's "The Changing Wealth of Nations: Measuring Sustainable Development in the New Millennium" (2011).
Categories, topics:
Economy & Growth
Last updated:
apr 23, 2017
Indicators value changes by year
Minimum:
246.046
jan 1, 1972
Maximum:
2.041K
jan 1, 2013
At the date of observation
Value
Absolute change
Change from previous value
jan 1, 1971
250.85
+250.85
0.0%
jan 1, 1972
246.046
-4.804
-1.92%
jan 1, 1973
261.925
+15.879
6.45%
jan 1, 1974
285.806
+23.881
9.12%
jan 1, 1975
313.035
+27.229
9.53%
jan 1, 1976
333.323
+20.288
6.48%
jan 1, 1977
381.217
+47.894
14.37%
jan 1, 1978
454.464
+73.246
19.21%
jan 1, 1979
502.265
+47.801
10.52%
jan 1, 1980
559.698
+57.432
11.43%
jan 1, 1981
610.636
+50.938
9.1%
jan 1, 1982
658.524
+47.888
7.84%
jan 1, 1983
623.272
-35.251
-5.35%
jan 1, 1984
672.07
+48.798
7.83%
jan 1, 1985
705.885
+33.815
5.03%
jan 1, 1986
758.741
+52.856
7.49%
jan 1, 1987
768.938
+10.197
1.34%
jan 1, 1988
808.171
+39.233
5.1%
jan 1, 1989
746.595
-61.576
-7.62%
jan 1, 1990
656.058
-90.537
-12.13%
jan 1, 1991
507.004
-149.054
-22.72%
jan 1, 1992
495.307
-11.696
-2.31%
jan 1, 1993
537.673
+42.365
8.55%
jan 1, 1994
565.733
+28.06
5.22%
jan 1, 1995
541.583
-24.15
-4.27%
jan 1, 1996
588.813
+47.23
8.72%
jan 1, 1997
601.377
+12.564
2.13%
jan 1, 1998
688.842
+87.465
14.54%
jan 1, 1999
763.311
+74.469
10.81%
jan 1, 2000
779.833
+16.522
2.16%
jan 1, 2001
1.023K
+243.308
31.2%
jan 1, 2002
1.066K
+42.459
4.15%
jan 1, 2003
1.067K
+1.603
0.15%
jan 1, 2004
1.091K
+23.472
2.2%
jan 1, 2005
1.141K
+50.351
4.62%
jan 1, 2006
1.237K
+96.401
8.45%
jan 1, 2007
1.346K
+108.787
8.79%
jan 1, 2008
1.526K
+180.061
13.38%
jan 1, 2009
1.696K
+169.446
11.1%
jan 1, 2010
1.781K
+85.441
5.04%
jan 1, 2011
1.813K
+32.148
1.8%
jan 1, 2012
1.969K
+155.908
8.6%
jan 1, 2013
2.041K
+71.522
3.63%
jan 1, 2014
1.988K
-52.427
-2.57%
jan 1, 2015
2.025K
+37.112
1.87%
Ranking of countries by current statistics by years


Comments: