29
/
en
AIzaSyAYiBZKx7MnpbEhh9jyipgxe19OcubqV5w
April 1, 2024
160175
Israel
ISR
true
2
1
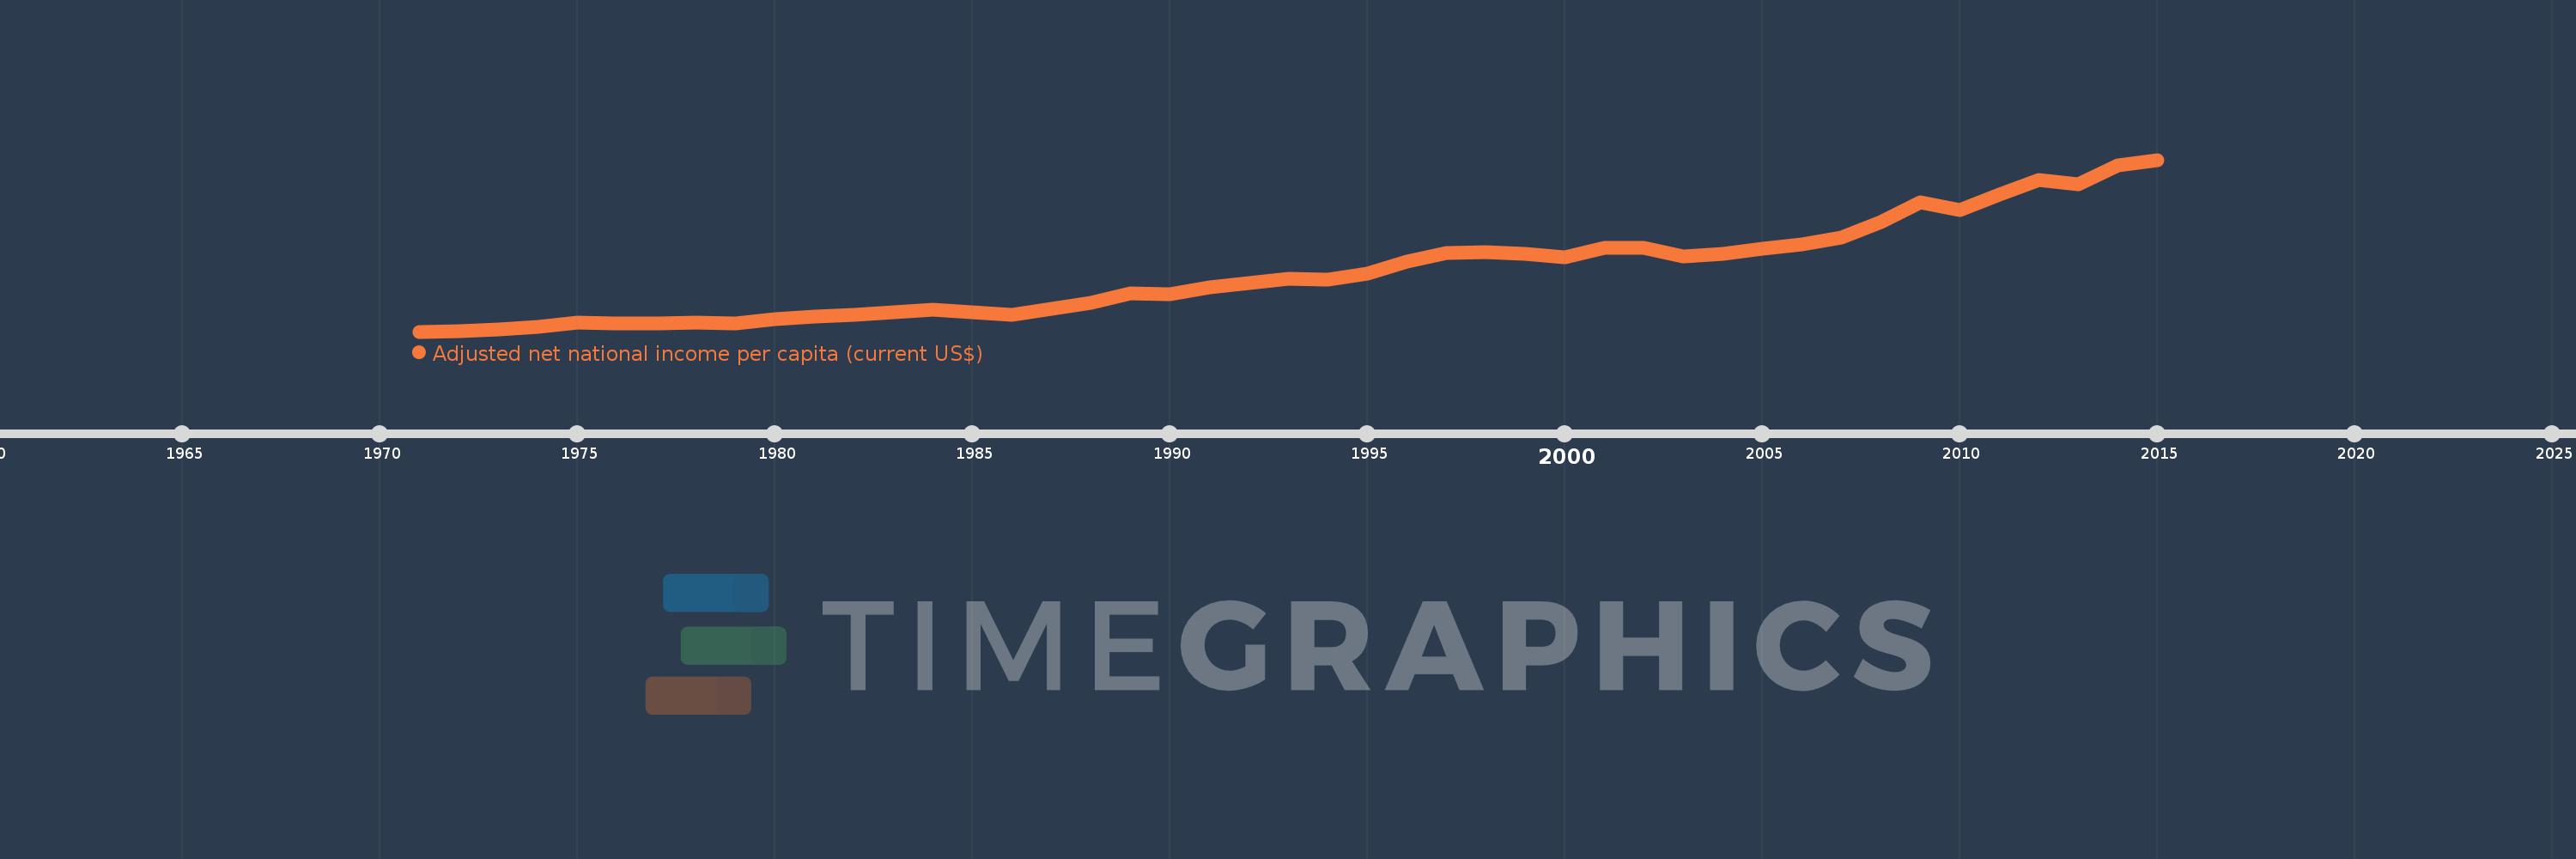
Adjusted net national income per capita (current US$)
2015,2014,2013,2012,2011,2010,2009,2008,2007,2006,2005,2004,2003,2002,2001,2000,1999,1998,1997,1996,1995,1994,1993,1992,1991,1990,1989,1988,1987,1986,1985,1984,1983,1982,1981,1980,1979,1978,1977,1976,1975,1974,1973,1972,1971
This statistics in other country:
AfghanistanAlbaniaAlgeriaAngolaArab WorldArgentinaArmeniaAustraliaAustriaAzerbaijanBahamas, TheBahrainBangladeshBarbadosBelarusBelgiumBelizeBeninBhutanBoliviaBotswanaBrazilBrunei DarussalamBulgariaBurkina FasoBurundiCabo VerdeCambodiaCameroonCanadaCaribbean small statesCentral African RepublicCentral Europe and the BalticsChadChileChinaColombiaComorosCongo, Dem. Rep.Congo, Rep.Costa RicaCote d'IvoireCroatiaCubaCyprusCzech RepublicDenmarkDjiboutiDominicaDominican RepublicEarly-demographic dividendEast Asia & PacificEast Asia & Pacific (excluding high income)East Asia & Pacific (IDA & IBRD countries)EcuadorEgypt, Arab Rep.El SalvadorEquatorial GuineaEritreaEstoniaEthiopiaEuro areaEurope & Central AsiaEurope & Central Asia (excluding high income)Europe & Central Asia (IDA & IBRD countries)European UnionFijiFinlandFragile and conflict affected situationsFranceGabonGambia, TheGeorgiaGermanyGhanaGreeceGuatemalaGuineaGuinea-BissauGuyanaHaitiHeavily indebted poor countries (HIPC)High incomeHondurasHong Kong SAR, ChinaHungaryIBRD onlyIcelandIDA & IBRD totalIDA blendIDA onlyIDA totalIndiaIndonesiaIran, Islamic Rep.IraqIrelandIsraelItalyJamaicaJapanJordanKazakhstanKenyaKiribatiKorea, Rep.KuwaitKyrgyz RepublicLao PDRLate-demographic dividendLatin America & Caribbean Latin America & Caribbean (excluding high income)Latin America & the Caribbean (IDA & IBRD countries)LatviaLeast developed countries: UN classificationLebanonLesothoLiberiaLibyaLithuaniaLow & middle incomeLow incomeLower middle incomeLuxembourgMacedonia, FYRMadagascarMalawiMalaysiaMaldivesMaliMauritaniaMauritiusMexicoMiddle East & North AfricaMiddle East & North Africa (excluding high income)Middle East & North Africa (IDA & IBRD countries)Middle incomeMoldovaMongoliaMoroccoMozambiqueMyanmarNamibiaNepalNetherlandsNew ZealandNicaraguaNigerNigeriaNorth AmericaNorwayOECD membersOmanOther small statesPacific island small statesPakistanPanamaPapua New GuineaParaguayPeruPhilippinesPolandPortugalPost-demographic dividendPre-demographic dividendQatarRomaniaRussian FederationRwandaSamoaSao Tome and PrincipeSaudi ArabiaSenegalSeychellesSierra LeoneSingaporeSlovak RepublicSloveniaSmall statesSolomon IslandsSouth AfricaSouth AsiaSouth Asia (IDA & IBRD)SpainSri LankaSt. LuciaSt. Vincent and the GrenadinesSub-Saharan Africa Sub-Saharan Africa (excluding high income)Sub-Saharan Africa (IDA & IBRD countries)SudanSurinameSwazilandSwedenSwitzerlandSyrian Arab RepublicTajikistanTanzaniaThailandTogoTongaTrinidad and TobagoTunisiaTurkeyTurkmenistanUgandaUkraineUnited Arab EmiratesUnited KingdomUnited StatesUpper middle incomeUruguayUzbekistanVanuatuVenezuela, RBVietnamWorldYemen, Rep.ZambiaZimbabwe Timeline:
This timeline shows a graph from 1971 to 2015 of Israel. No data until 1970. Number of actual observations by date: 45.
Source name:
World Development Indicators
Source organization:
World Bank staff estimates based on sources and methods in World Bank's "The Changing Wealth of Nations: Measuring Sustainable Development in the New Millennium" (2011).
Categories, topics:
Economy & Growth
Last updated:
apr 23, 2017
Indicators value changes by year
Maximum:
31.73K
jan 1, 2015
At the date of observation
Value
Absolute change
Change from previous value
jan 1, 1971
1.59K
+1.59K
0.0%
jan 1, 1972
1.602K
+12.034
0.76%
jan 1, 1973
2.007K
+404.867
25.27%
jan 1, 1974
2.427K
+420.227
20.94%
jan 1, 1975
3.179K
+752.068
30.98%
jan 1, 1976
3.008K
-171.892
-5.41%
jan 1, 1977
2.962K
-45.885
-1.53%
jan 1, 1978
3.215K
+253.054
8.54%
jan 1, 1979
3.05K
-165.033
-5.13%
jan 1, 1980
3.794K
+744.707
24.42%
jan 1, 1981
4.211K
+416.168
10.97%
jan 1, 1982
4.476K
+265.502
6.31%
jan 1, 1983
4.995K
+519.402
11.6%
jan 1, 1984
5.505K
+509.271
10.19%
jan 1, 1985
5.025K
-479.801
-8.72%
jan 1, 1986
4.577K
-448.188
-8.92%
jan 1, 1987
5.592K
+1.015K
22.18%
jan 1, 1988
6.664K
+1.073K
19.18%
jan 1, 1989
8.248K
+1.583K
23.76%
jan 1, 1990
8.181K
-66.394
-0.8%
jan 1, 1991
9.41K
+1.229K
15.02%
jan 1, 1992
10.134K
+723.215
7.69%
jan 1, 1993
10.92K
+786.358
7.76%
jan 1, 1994
10.658K
-262.426
-2.4%
jan 1, 1995
11.807K
+1.15K
10.79%
jan 1, 1996
13.878K
+2.07K
17.54%
jan 1, 1997
15.341K
+1.463K
10.55%
jan 1, 1998
15.549K
+208.454
1.36%
jan 1, 1999
15.203K
-346.284
-2.23%
jan 1, 2000
14.613K
-589.862
-3.88%
jan 1, 2001
16.356K
+1.742K
11.92%
jan 1, 2002
16.314K
-41.546
-0.25%
jan 1, 2003
14.804K
-1.51K
-9.25%
jan 1, 2004
15.157K
+352.399
2.38%
jan 1, 2005
16.192K
+1.035K
6.83%
jan 1, 2006
16.914K
+722.668
4.46%
jan 1, 2007
18.134K
+1.219K
7.21%
jan 1, 2008
20.806K
+2.672K
14.74%
jan 1, 2009
24.272K
+3.466K
16.66%
jan 1, 2010
22.855K
-1.417K
-5.84%
jan 1, 2011
25.644K
+2.789K
12.2%
jan 1, 2012
28.255K
+2.611K
10.18%
jan 1, 2013
27.438K
-816.655
-2.89%
jan 1, 2014
30.71K
+3.272K
11.93%
jan 1, 2015
31.73K
+1.02K
3.32%
Ranking of countries by current statistics by years


Comments: