29
/
en
AIzaSyAYiBZKx7MnpbEhh9jyipgxe19OcubqV5w
April 1, 2024
52211
North America
NAC
false
2
1
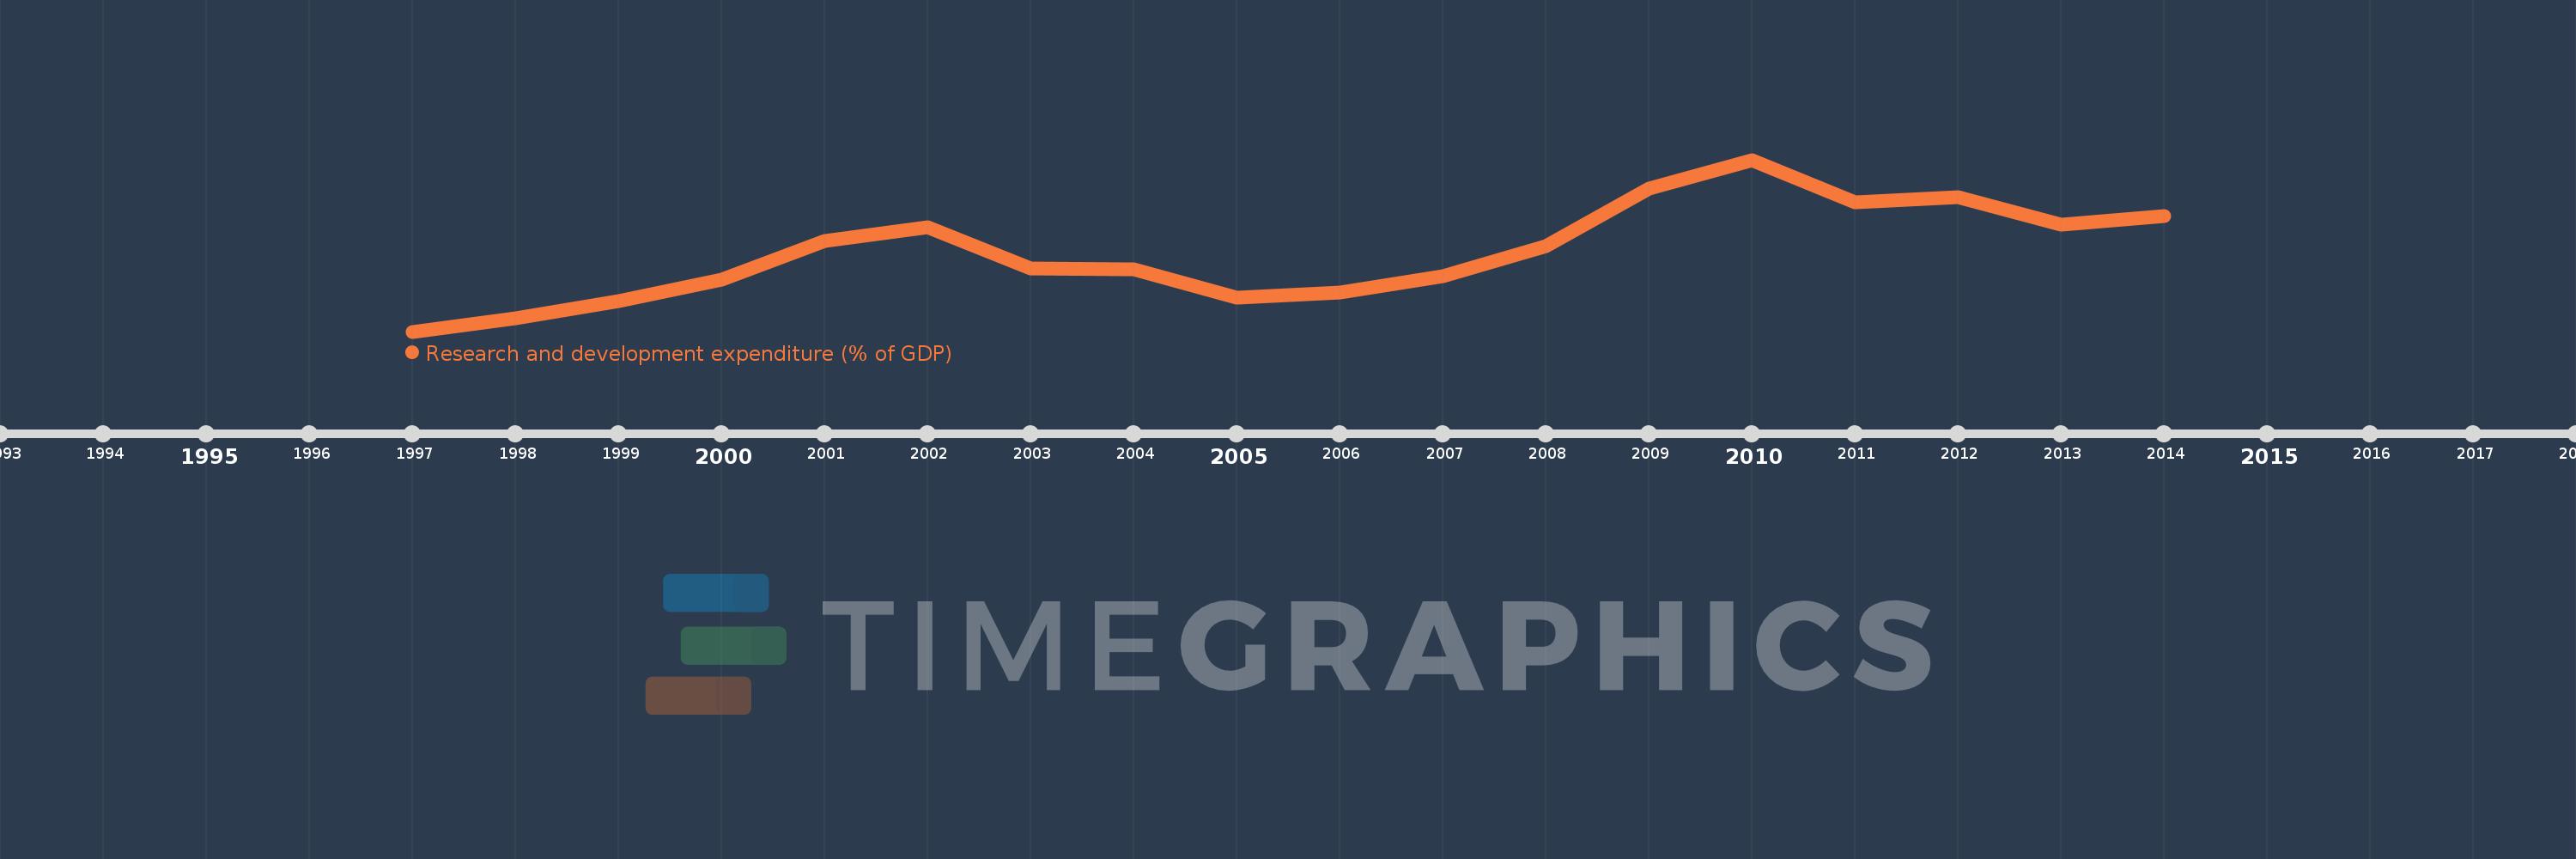
Research and development expenditure (% of GDP)
2014,2013,2012,2011,2010,2009,2008,2007,2006,2005,2004,2003,2002,2001,2000,1999,1998,1997
This statistics in other country:
Timeline:
This timeline shows a graph from 1997 to 2014 of North America. No data until 1996. Number of actual observations by date: 18.
Source name:
World Development Indicators
Source organization:
United Nations Educational, Scientific, and Cultural Organization (UNESCO) Institute for Statistics.
Categories, topics:
Science & Technology
Last updated:
apr 23, 2017
Indicators value changes by year
At the date of observation
Value
Absolute change
Change from previous value
jan 1, 1997
2.382
+2.382
0.0%
jan 1, 1998
2.41
+0.028
1.18%
jan 1, 1999
2.446
+0.036
1.48%
jan 1, 2000
2.491
+0.045
1.82%
jan 1, 2001
2.57
+0.079
3.19%
jan 1, 2002
2.599
+0.029
1.14%
jan 1, 2003
2.514
-0.086
-3.3%
jan 1, 2004
2.512
-0.002
-0.07%
jan 1, 2005
2.453
-0.059
-2.34%
jan 1, 2006
2.463
+0.01
0.41%
jan 1, 2007
2.498
+0.035
1.42%
jan 1, 2008
2.561
+0.062
2.5%
jan 1, 2009
2.68
+0.119
4.66%
jan 1, 2010
2.74
+0.06
2.22%
jan 1, 2011
2.652
-0.088
-3.22%
jan 1, 2012
2.662
+0.011
0.4%
jan 1, 2013
2.605
-0.058
-2.17%
jan 1, 2014
2.622
+0.017
0.65%
Ranking of countries by current statistics by years


Comments: