29
/
en
AIzaSyAYiBZKx7MnpbEhh9jyipgxe19OcubqV5w
April 1, 2024
159851
Ireland
IRL
true
2
1
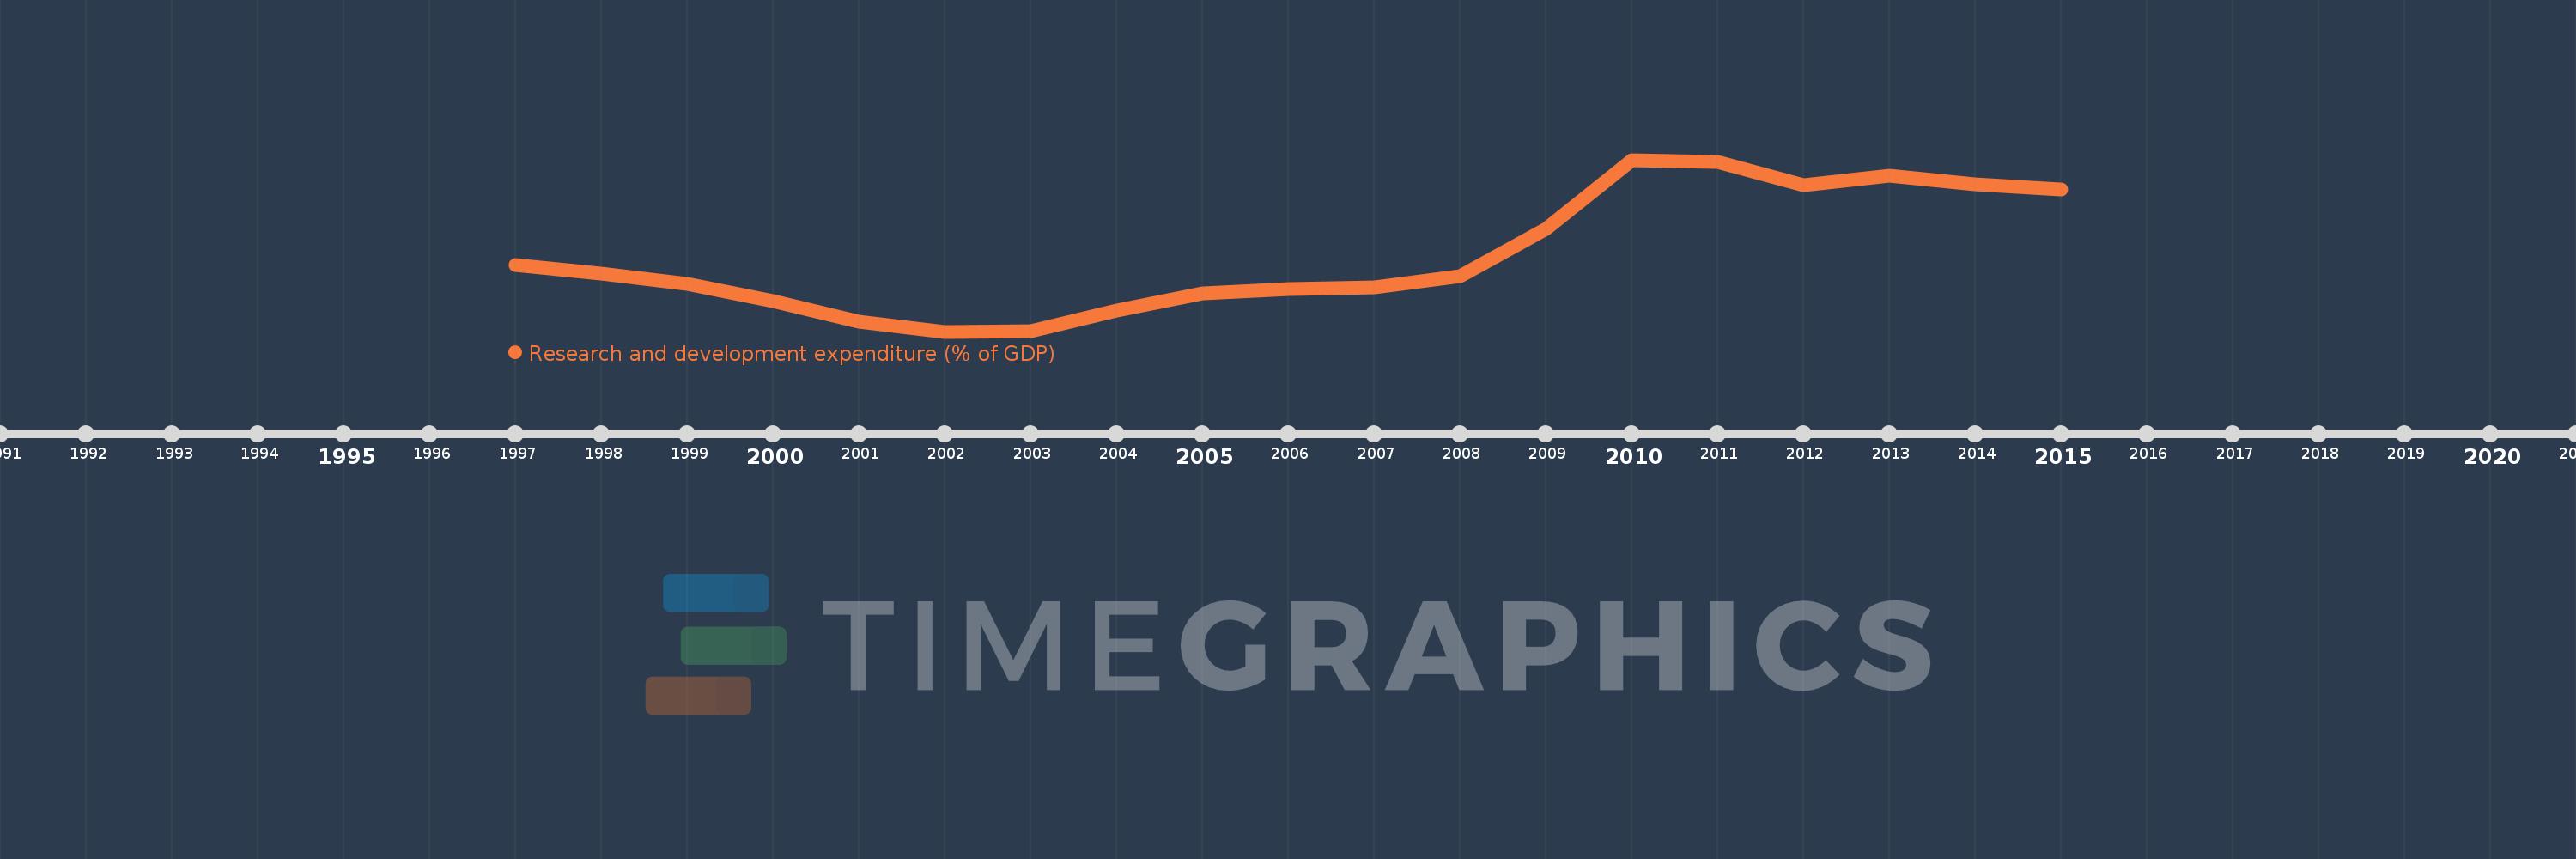
Research and development expenditure (% of GDP)
2015,2014,2013,2012,2011,2010,2009,2008,2007,2006,2005,2004,2003,2002,2001,2000,1999,1998,1997
This statistics in other country:
Timeline:
This timeline shows a graph from 1997 to 2015 of Ireland. No data until 1996. Number of actual observations by date: 19.
Source name:
World Development Indicators
Source organization:
United Nations Educational, Scientific, and Cultural Organization (UNESCO) Institute for Statistics.
Categories, topics:
Science & Technology
Last updated:
apr 23, 2017
Indicators value changes by year
At the date of observation
Value
Absolute change
Change from previous value
jan 1, 1997
1.271
+1.271
0.0%
jan 1, 1998
1.243
-0.027
-2.14%
jan 1, 1999
1.21
-0.034
-2.7%
jan 1, 2000
1.153
-0.056
-4.65%
jan 1, 2001
1.085
-0.068
-5.92%
jan 1, 2002
1.054
-0.032
-2.91%
jan 1, 2003
1.056
+0.003
0.24%
jan 1, 2004
1.123
+0.067
6.31%
jan 1, 2005
1.178
+0.056
4.95%
jan 1, 2006
1.194
+0.016
1.35%
jan 1, 2007
1.199
+0.005
0.38%
jan 1, 2008
1.234
+0.035
2.95%
jan 1, 2009
1.389
+0.155
12.57%
jan 1, 2010
1.615
+0.225
16.21%
jan 1, 2011
1.607
-0.008
-0.49%
jan 1, 2012
1.533
-0.074
-4.6%
jan 1, 2013
1.564
+0.031
2.02%
jan 1, 2014
1.536
-0.028
-1.77%
jan 1, 2015
1.519
-0.017
-1.11%
Ranking of countries by current statistics by years


Comments: