29
/
en
AIzaSyAYiBZKx7MnpbEhh9jyipgxe19OcubqV5w
April 1, 2024
118395
Czech Republic
CZE
true
2
1
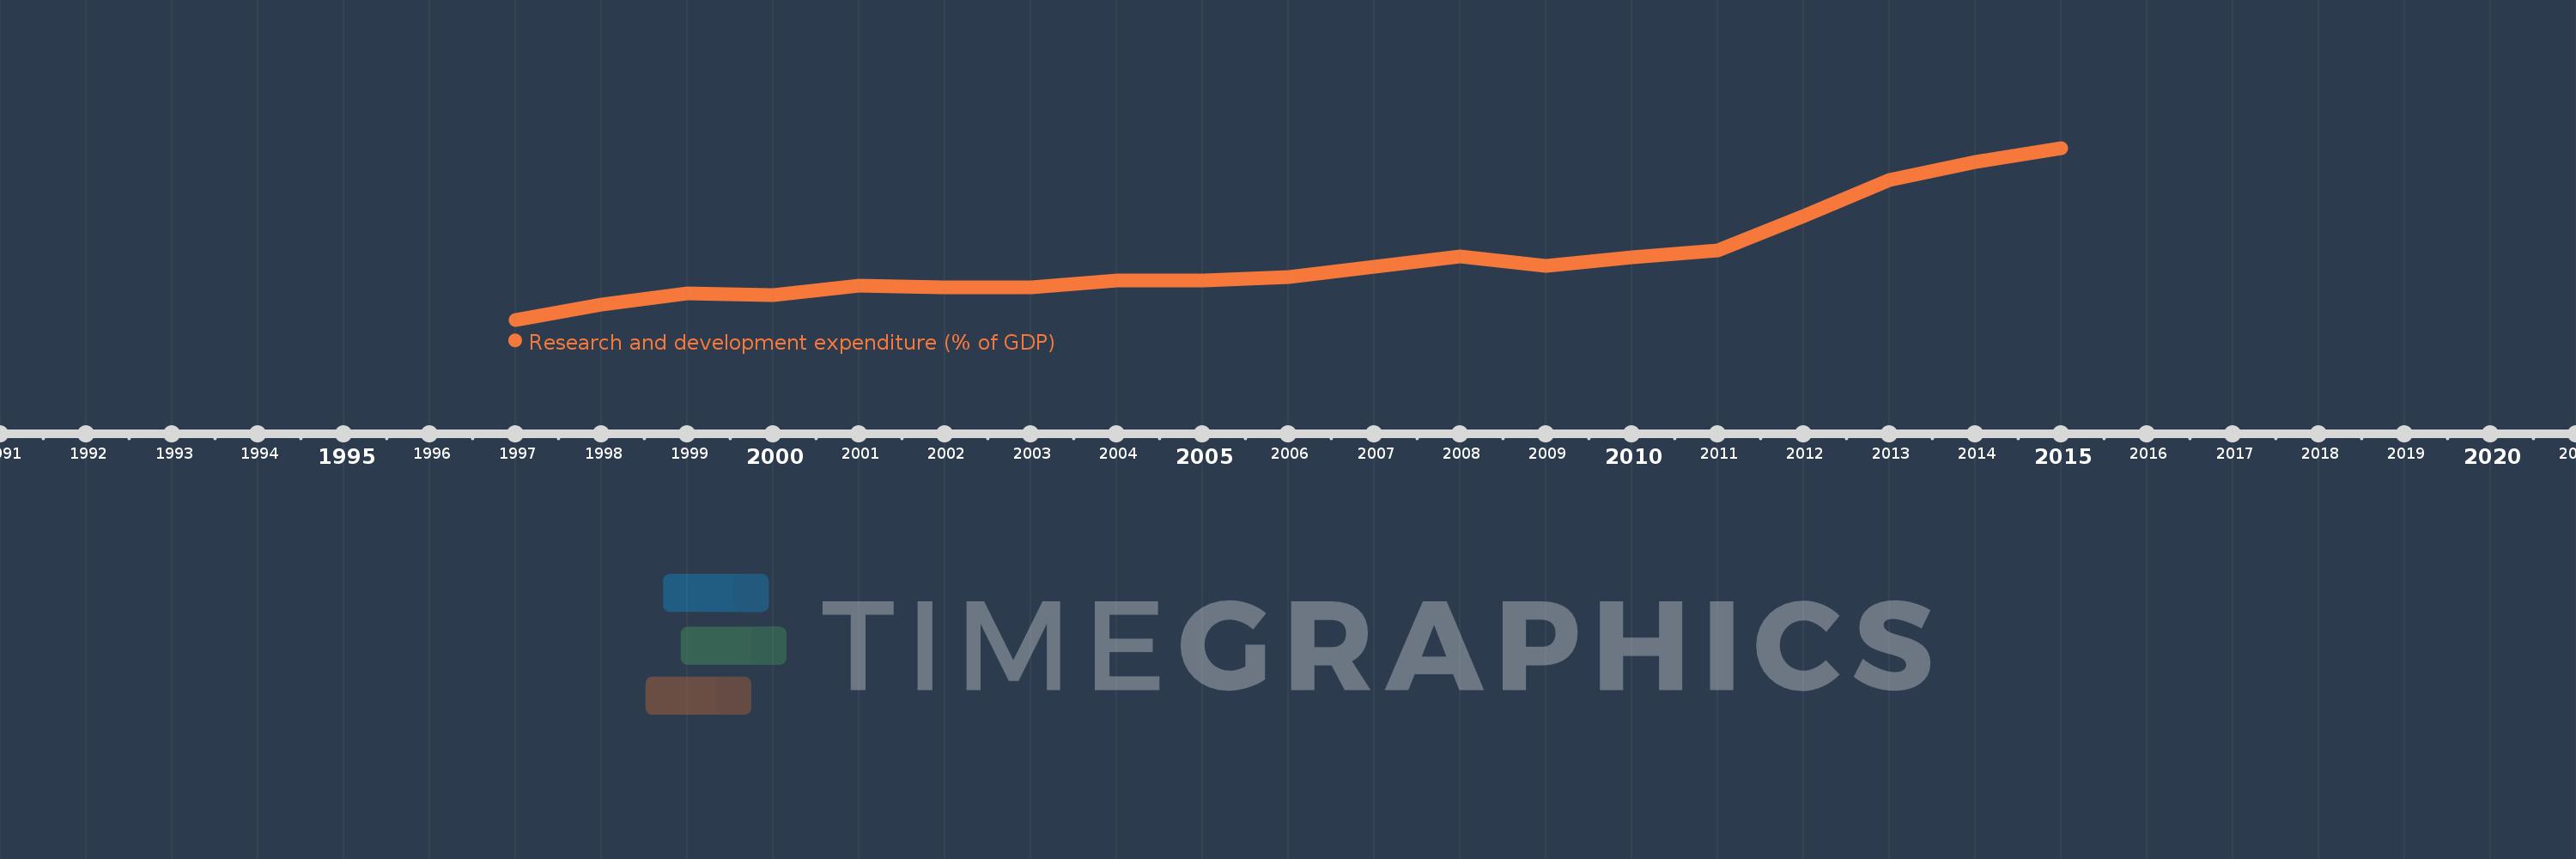
Research and development expenditure (% of GDP)
2015,2014,2013,2012,2011,2010,2009,2008,2007,2006,2005,2004,2003,2002,2001,2000,1999,1998,1997
This statistics in other country:
Timeline:
This timeline shows a graph from 1997 to 2015 of Czech Republic. No data until 1996. Number of actual observations by date: 19.
Source name:
World Development Indicators
Source organization:
United Nations Educational, Scientific, and Cultural Organization (UNESCO) Institute for Statistics.
Categories, topics:
Science & Technology
Last updated:
apr 23, 2017
Indicators value changes by year
At the date of observation
Value
Absolute change
Change from previous value
jan 1, 1997
0.897
+0.897
0.0%
jan 1, 1998
0.997
+0.1
11.13%
jan 1, 1999
1.067
+0.07
7.02%
jan 1, 2000
1.057
-0.01
-0.96%
jan 1, 2001
1.116
+0.059
5.62%
jan 1, 2002
1.106
-0.011
-0.95%
jan 1, 2003
1.105
-0.001
-0.08%
jan 1, 2004
1.151
+0.046
4.19%
jan 1, 2005
1.147
-0.004
-0.33%
jan 1, 2006
1.171
+0.023
2.04%
jan 1, 2007
1.234
+0.063
5.37%
jan 1, 2008
1.305
+0.071
5.78%
jan 1, 2009
1.242
-0.063
-4.83%
jan 1, 2010
1.297
+0.055
4.44%
jan 1, 2011
1.34
+0.043
3.29%
jan 1, 2012
1.56
+0.22
16.43%
jan 1, 2013
1.79
+0.23
14.76%
jan 1, 2014
1.91
+0.119
6.65%
jan 1, 2015
1.997
+0.088
4.6%
Ranking of countries by current statistics by years


Comments: