29
/
en
AIzaSyAYiBZKx7MnpbEhh9jyipgxe19OcubqV5w
April 1, 2024
214752
Norway
NOR
true
2
1
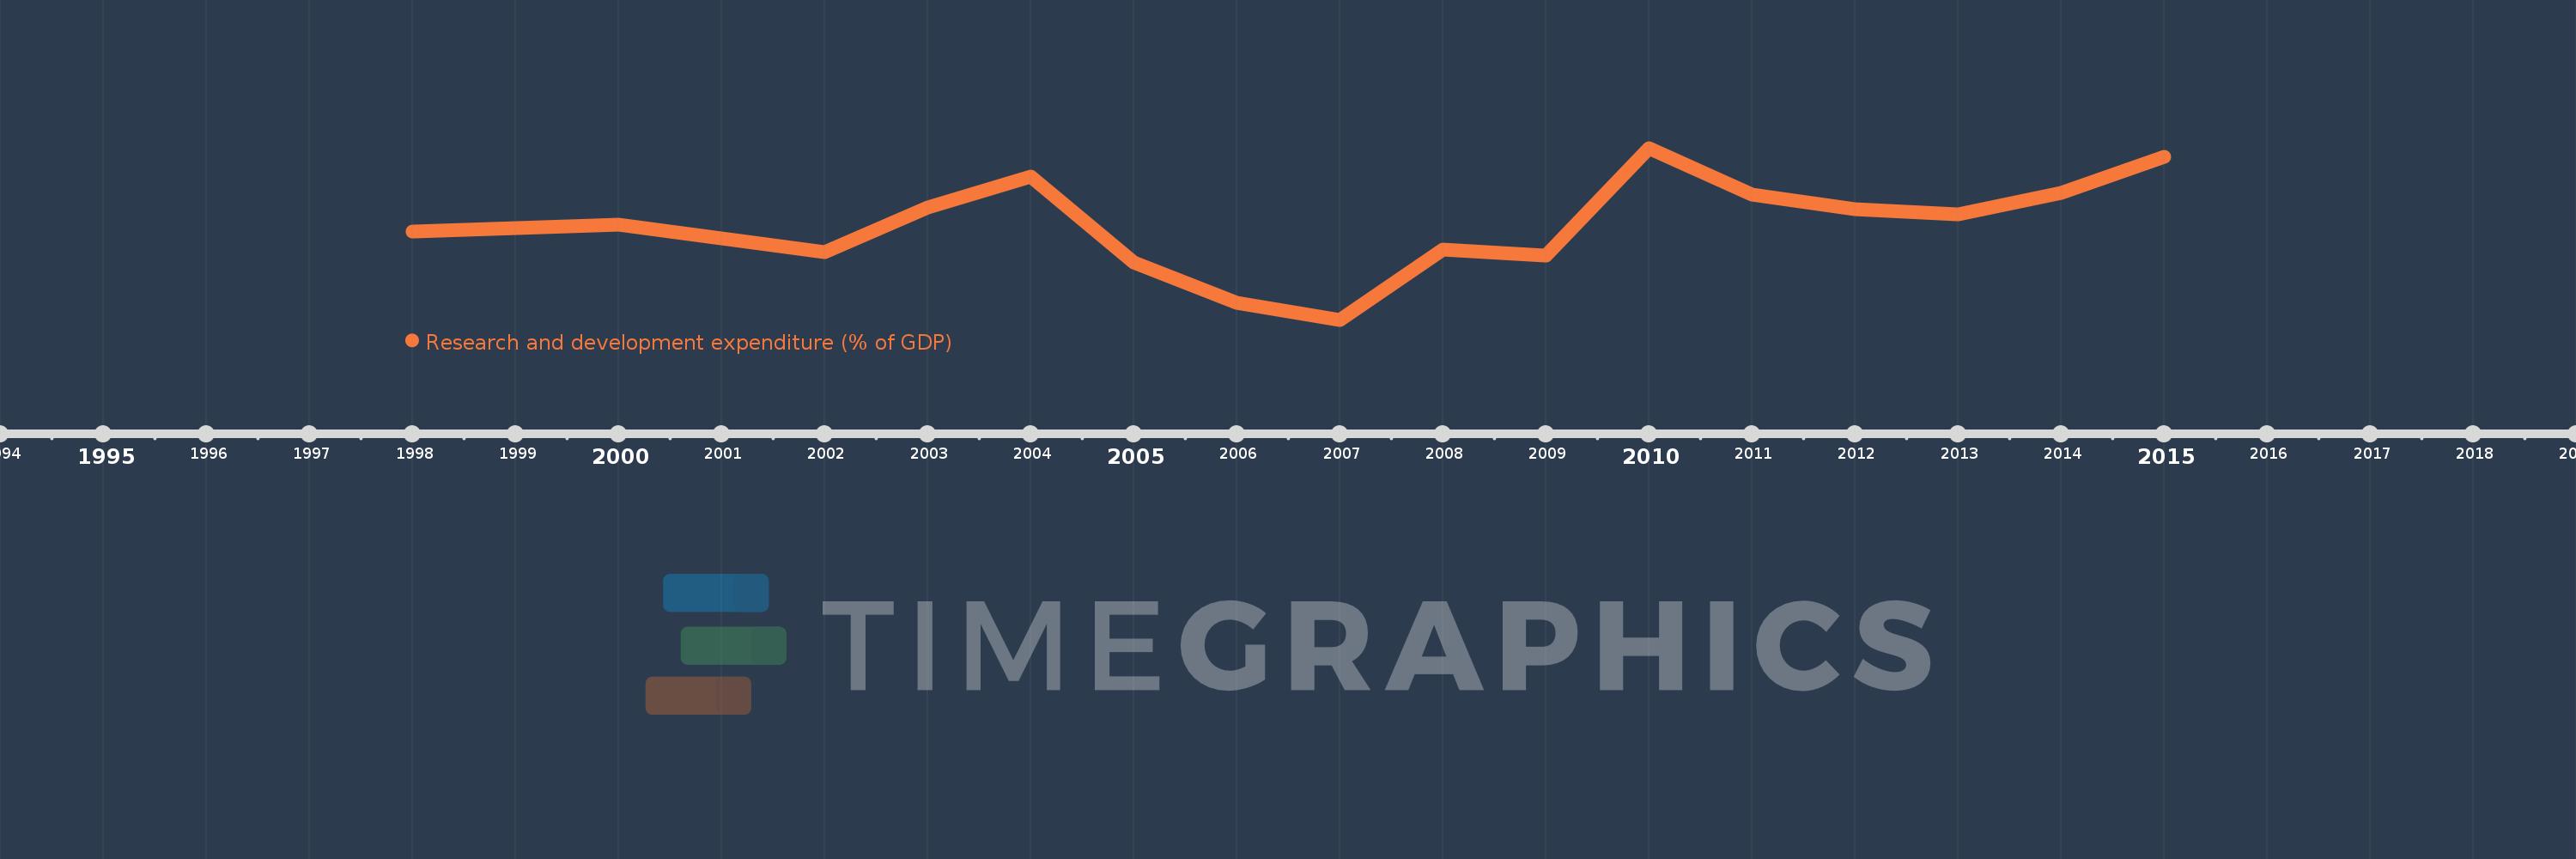
Research and development expenditure (% of GDP)
2015,2014,2013,2012,2011,2010,2009,2008,2007,2006,2005,2004,2003,2002,2000,1998
This statistics in other country:
Timeline:
This timeline shows a graph from 1998 to 2015 of Norway. No data until 1997. Number of actual observations by date: 16.
Source name:
World Development Indicators
Source organization:
United Nations Educational, Scientific, and Cultural Organization (UNESCO) Institute for Statistics.
Categories, topics:
Science & Technology
Last updated:
apr 23, 2017
Indicators value changes by year
At the date of observation
Value
Absolute change
Change from previous value
jan 1, 1998
1.594
+1.594
0.0%
jan 1, 2000
1.605
+0.012
0.74%
jan 1, 2002
1.562
-0.043
-2.68%
jan 1, 2003
1.631
+0.068
4.37%
jan 1, 2004
1.68
+0.05
3.05%
jan 1, 2005
1.545
-0.135
-8.05%
jan 1, 2006
1.483
-0.062
-4.01%
jan 1, 2007
1.456
-0.027
-1.83%
jan 1, 2008
1.565
+0.109
7.47%
jan 1, 2009
1.556
-0.009
-0.59%
jan 1, 2010
1.724
+0.168
10.82%
jan 1, 2011
1.651
-0.073
-4.23%
jan 1, 2012
1.628
-0.023
-1.41%
jan 1, 2013
1.62
-0.007
-0.45%
jan 1, 2014
1.654
+0.033
2.06%
jan 1, 2015
1.71
+0.057
3.42%
Ranking of countries by current statistics by years


Comments: