29
/
en
AIzaSyAYiBZKx7MnpbEhh9jyipgxe19OcubqV5w
April 1, 2024
62160
Upper middle income
UMC
false
2
1
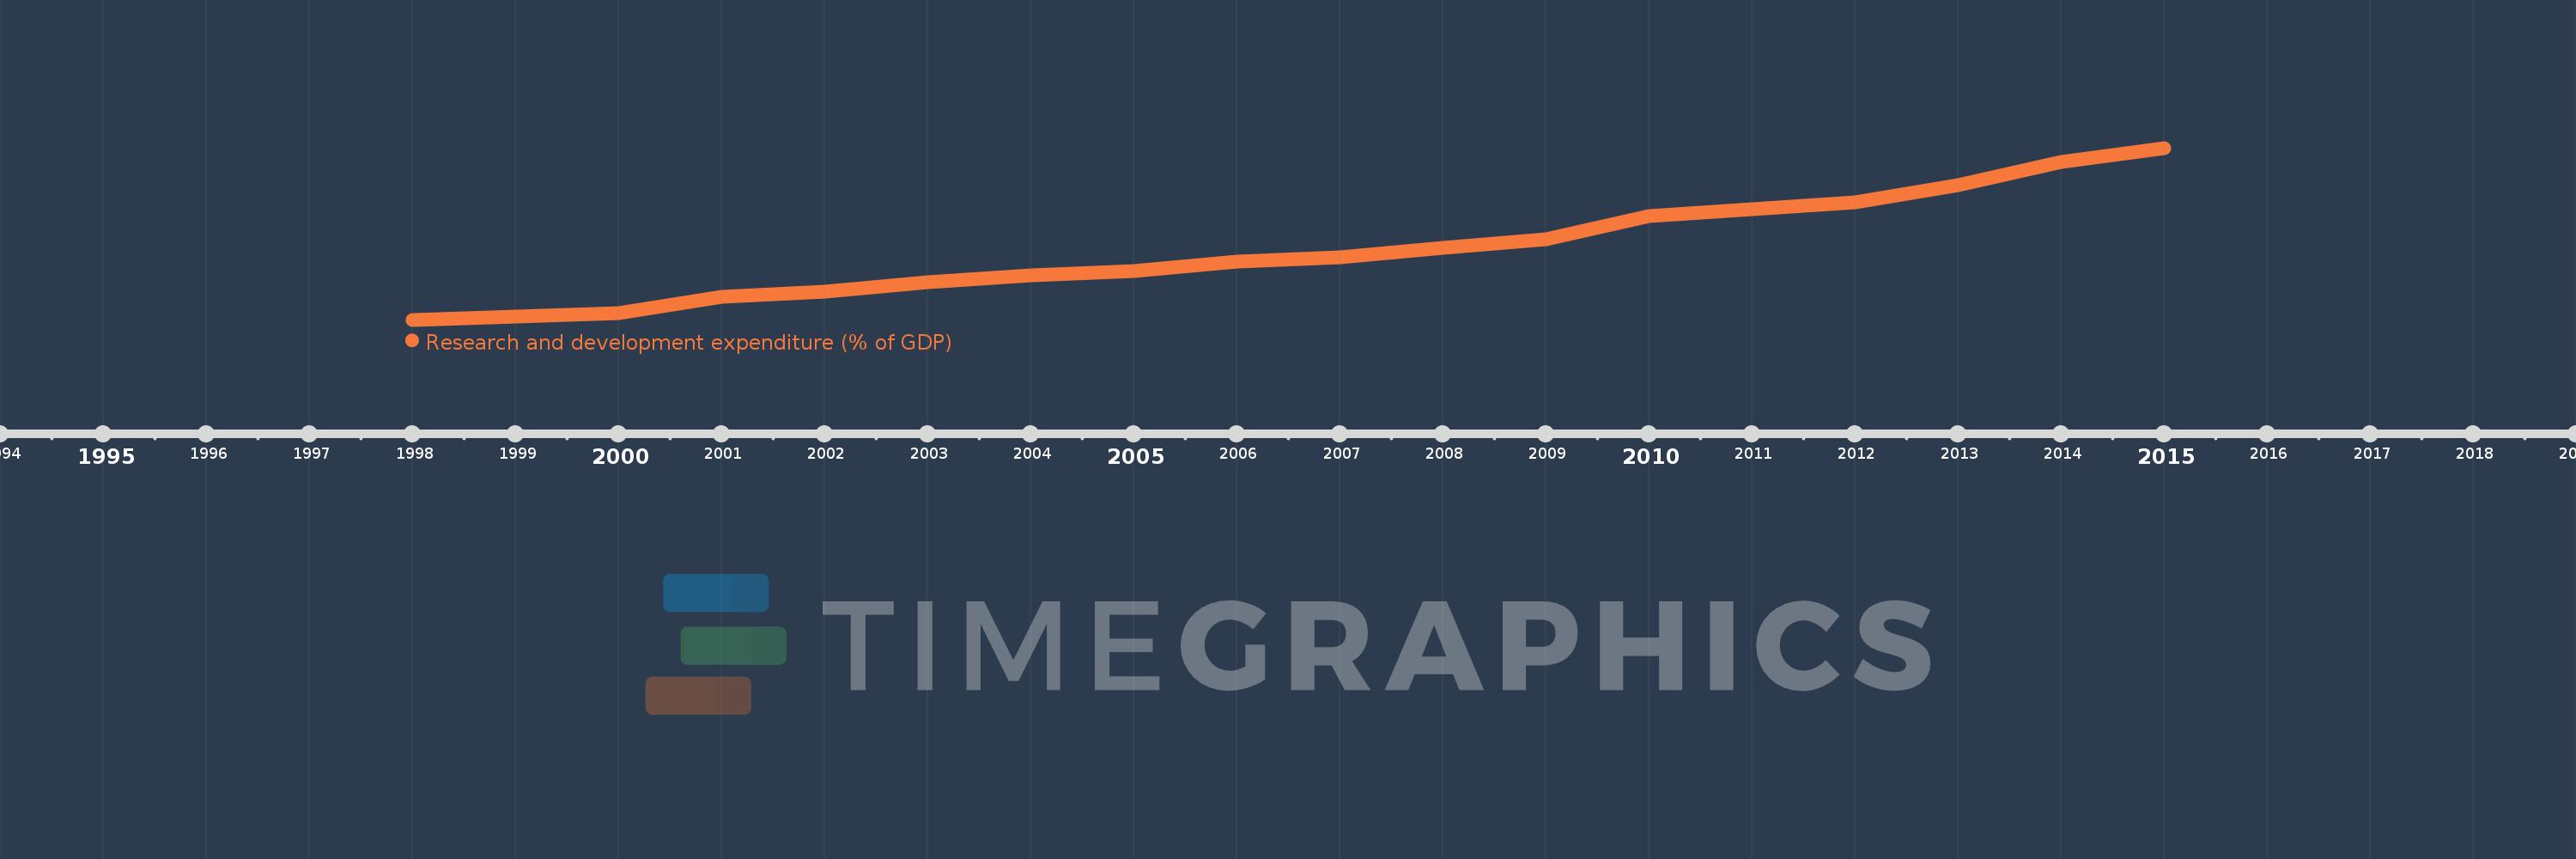
Research and development expenditure (% of GDP)
2015,2014,2013,2012,2011,2010,2009,2008,2007,2006,2005,2004,2003,2002,2001,2000,1998
This statistics in other country:
Timeline:
This timeline shows a graph from 1998 to 2015 of Upper middle income. No data until 1997. Number of actual observations by date: 17.
Source name:
World Development Indicators
Source organization:
United Nations Educational, Scientific, and Cultural Organization (UNESCO) Institute for Statistics.
Categories, topics:
Science & Technology
Last updated:
apr 23, 2017
Indicators value changes by year
At the date of observation
Value
Absolute change
Change from previous value
jan 1, 1998
0.54
+0.54
0.0%
jan 1, 2000
0.578
+0.038
7.05%
jan 1, 2001
0.679
+0.101
17.51%
jan 1, 2002
0.707
+0.028
4.11%
jan 1, 2003
0.765
+0.059
8.29%
jan 1, 2004
0.807
+0.042
5.47%
jan 1, 2005
0.83
+0.023
2.85%
jan 1, 2006
0.888
+0.058
6.98%
jan 1, 2007
0.916
+0.028
3.17%
jan 1, 2008
0.972
+0.055
6.03%
jan 1, 2009
1.024
+0.052
5.36%
jan 1, 2010
1.164
+0.141
13.73%
jan 1, 2011
1.201
+0.036
3.11%
jan 1, 2012
1.245
+0.044
3.67%
jan 1, 2013
1.349
+0.104
8.35%
jan 1, 2014
1.488
+0.139
10.32%
jan 1, 2015
1.571
+0.084
5.62%
Ranking of countries by current statistics by years


Comments: