29
/
en
AIzaSyAYiBZKx7MnpbEhh9jyipgxe19OcubqV5w
April 1, 2024
63002
World
WLD
false
2
1
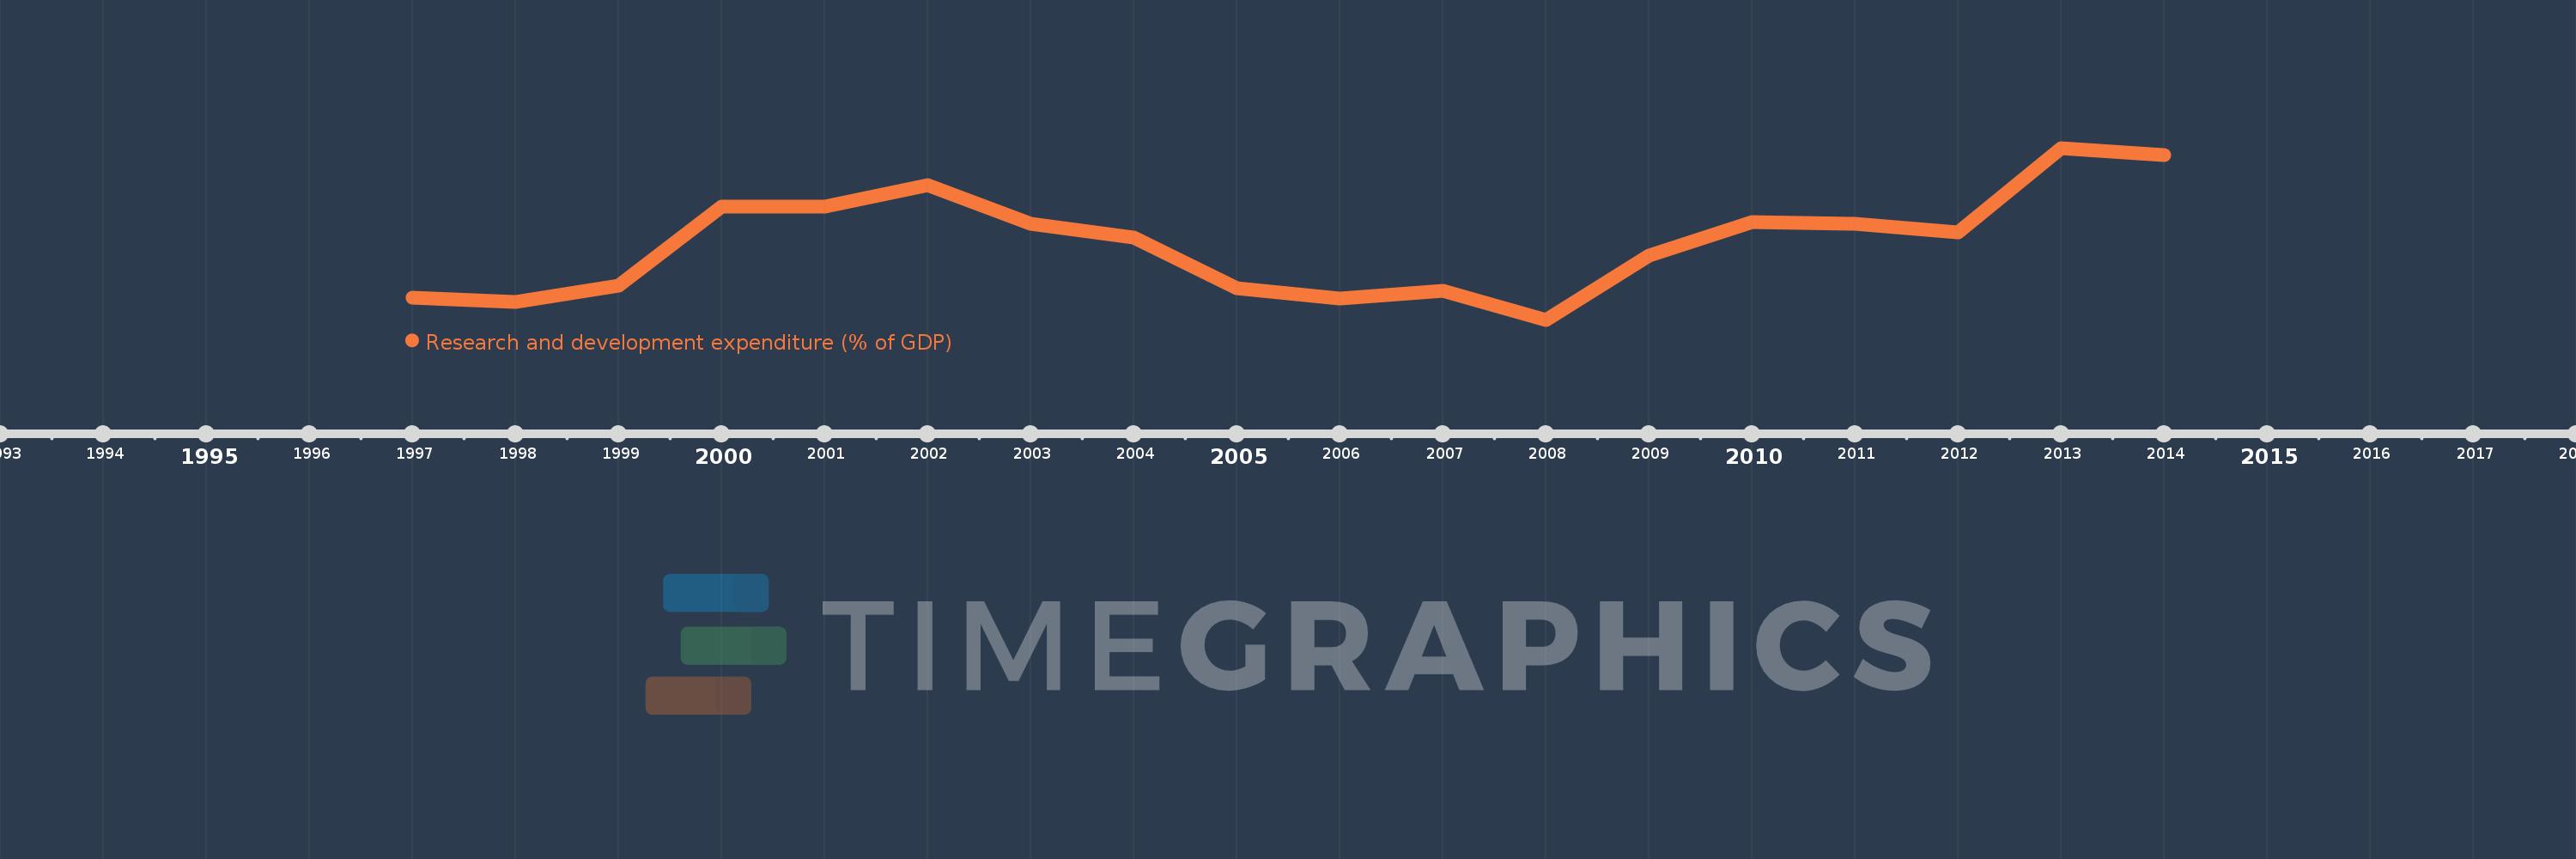
Research and development expenditure (% of GDP)
2014,2013,2012,2011,2010,2009,2008,2007,2006,2005,2004,2003,2002,2001,2000,1999,1998,1997
This statistics in other country:
Timeline:
This timeline shows a graph from 1997 to 2014 of World. No data until 1996. Number of actual observations by date: 18.
Source name:
World Development Indicators
Source organization:
United Nations Educational, Scientific, and Cultural Organization (UNESCO) Institute for Statistics.
Categories, topics:
Science & Technology
Last updated:
apr 23, 2017
Indicators value changes by year
At the date of observation
Value
Absolute change
Change from previous value
jan 1, 1997
1.987
+1.987
0.0%
jan 1, 1998
1.983
-0.004
-0.21%
jan 1, 1999
1.999
+0.017
0.84%
jan 1, 2000
2.075
+0.075
3.77%
jan 1, 2001
2.075
+0.001
0.04%
jan 1, 2002
2.095
+0.02
0.96%
jan 1, 2003
2.058
-0.038
-1.8%
jan 1, 2004
2.045
-0.012
-0.61%
jan 1, 2005
1.996
-0.049
-2.4%
jan 1, 2006
1.986
-0.01
-0.51%
jan 1, 2007
1.994
+0.008
0.42%
jan 1, 2008
1.966
-0.029
-1.44%
jan 1, 2009
2.028
+0.062
3.15%
jan 1, 2010
2.06
+0.032
1.59%
jan 1, 2011
2.058
-0.002
-0.1%
jan 1, 2012
2.05
-0.008
-0.39%
jan 1, 2013
2.131
+0.081
3.97%
jan 1, 2014
2.124
-0.007
-0.32%
Ranking of countries by current statistics by years


Comments: