29
/
en
AIzaSyAYiBZKx7MnpbEhh9jyipgxe19OcubqV5w
April 1, 2024
248006
Spain
ESP
true
2
1
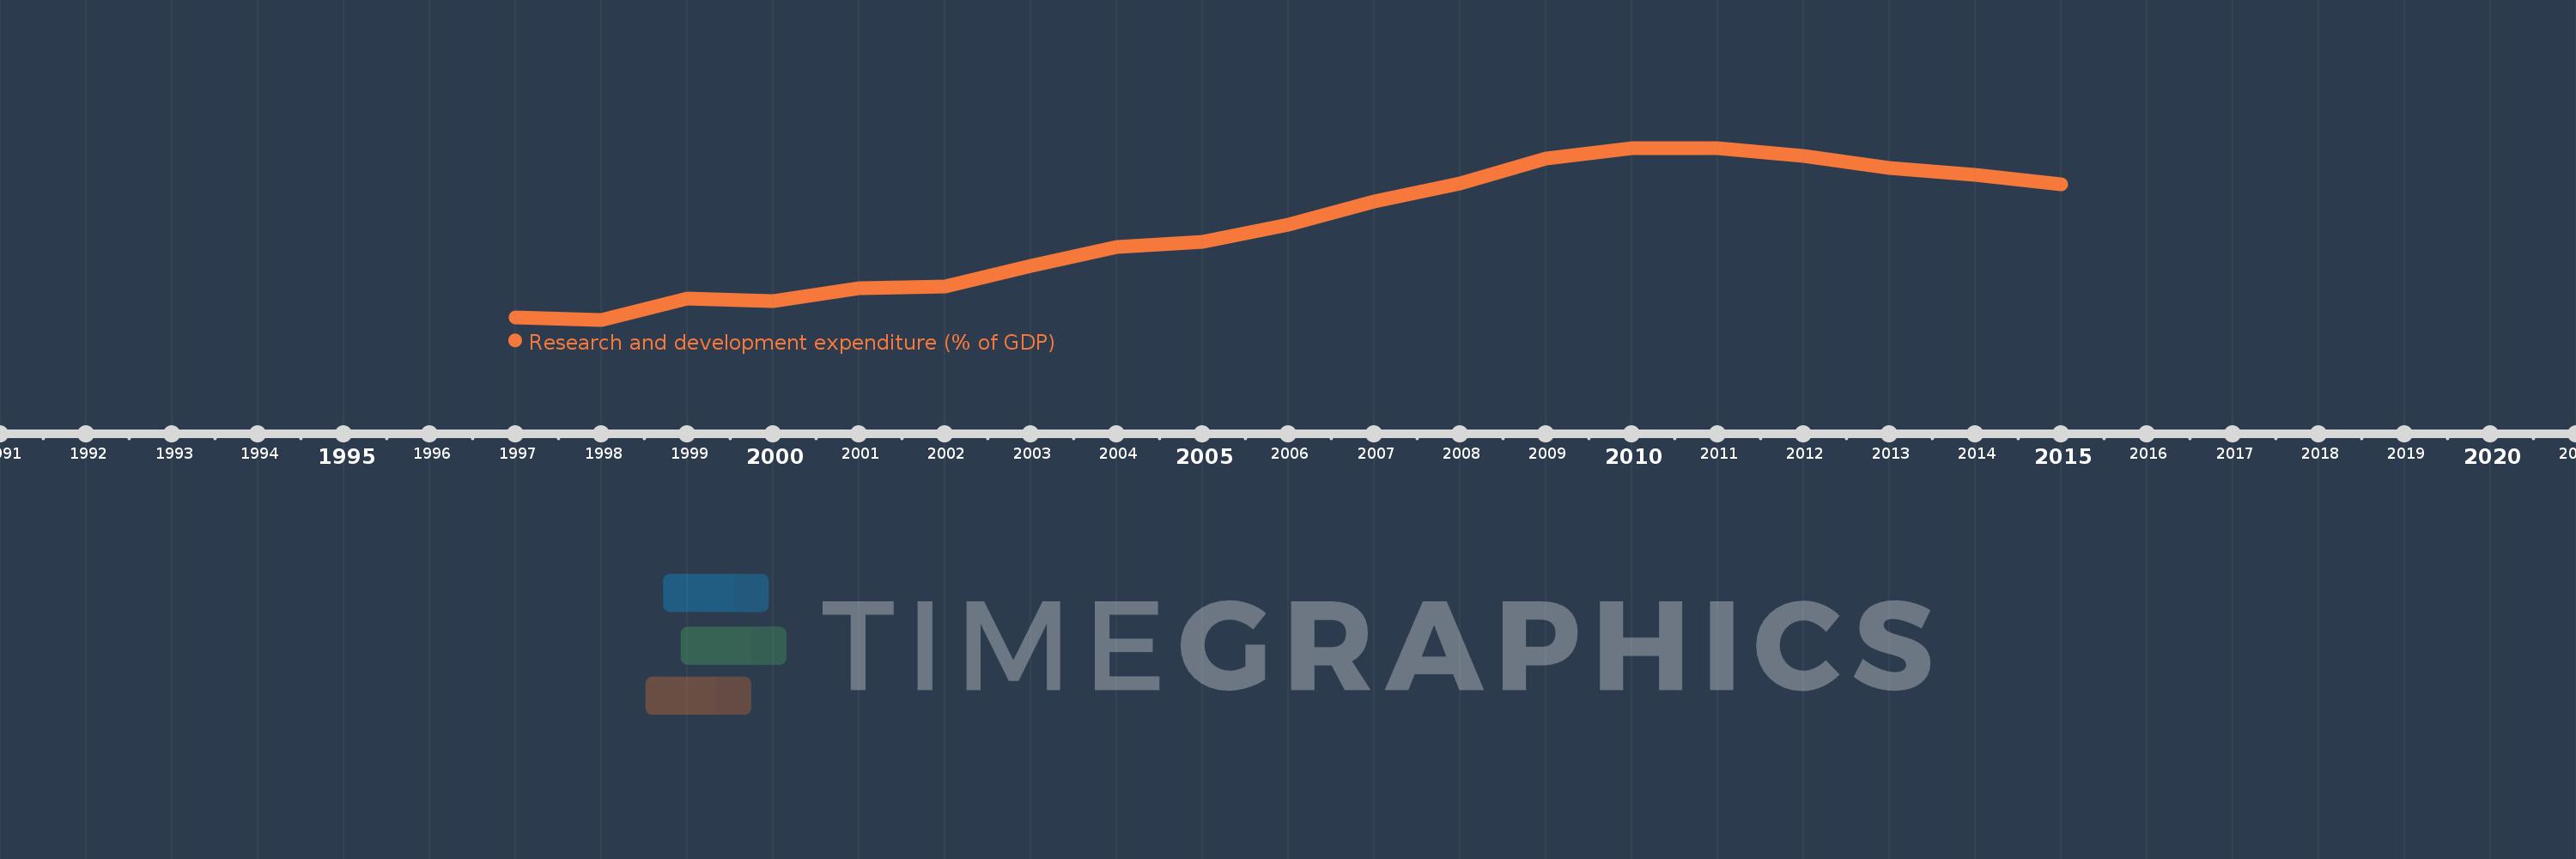
Research and development expenditure (% of GDP)
2015,2014,2013,2012,2011,2010,2009,2008,2007,2006,2005,2004,2003,2002,2001,2000,1999,1998,1997
This statistics in other country:
Timeline:
This timeline shows a graph from 1997 to 2015 of Spain. No data until 1996. Number of actual observations by date: 19.
Source name:
World Development Indicators
Source organization:
United Nations Educational, Scientific, and Cultural Organization (UNESCO) Institute for Statistics.
Categories, topics:
Science & Technology
Last updated:
apr 23, 2017
Indicators value changes by year
At the date of observation
Value
Absolute change
Change from previous value
jan 1, 1997
0.789
+0.789
0.0%
jan 1, 1998
0.78
-0.01
-1.25%
jan 1, 1999
0.851
+0.071
9.16%
jan 1, 2000
0.841
-0.01
-1.23%
jan 1, 2001
0.885
+0.044
5.29%
jan 1, 2002
0.89
+0.005
0.59%
jan 1, 2003
0.96
+0.07
7.85%
jan 1, 2004
1.022
+0.062
6.47%
jan 1, 2005
1.038
+0.016
1.59%
jan 1, 2006
1.096
+0.057
5.52%
jan 1, 2007
1.172
+0.076
6.97%
jan 1, 2008
1.234
+0.062
5.31%
jan 1, 2009
1.317
+0.083
6.69%
jan 1, 2010
1.351
+0.034
2.6%
jan 1, 2011
1.35
-0.002
-0.13%
jan 1, 2012
1.325
-0.025
-1.82%
jan 1, 2013
1.284
-0.041
-3.1%
jan 1, 2014
1.262
-0.022
-1.74%
jan 1, 2015
1.231
-0.03
-2.4%
Ranking of countries by current statistics by years


Comments: