29
/
en
AIzaSyAYiBZKx7MnpbEhh9jyipgxe19OcubqV5w
April 1, 2024
138711
Georgia
GEO
true
2
1
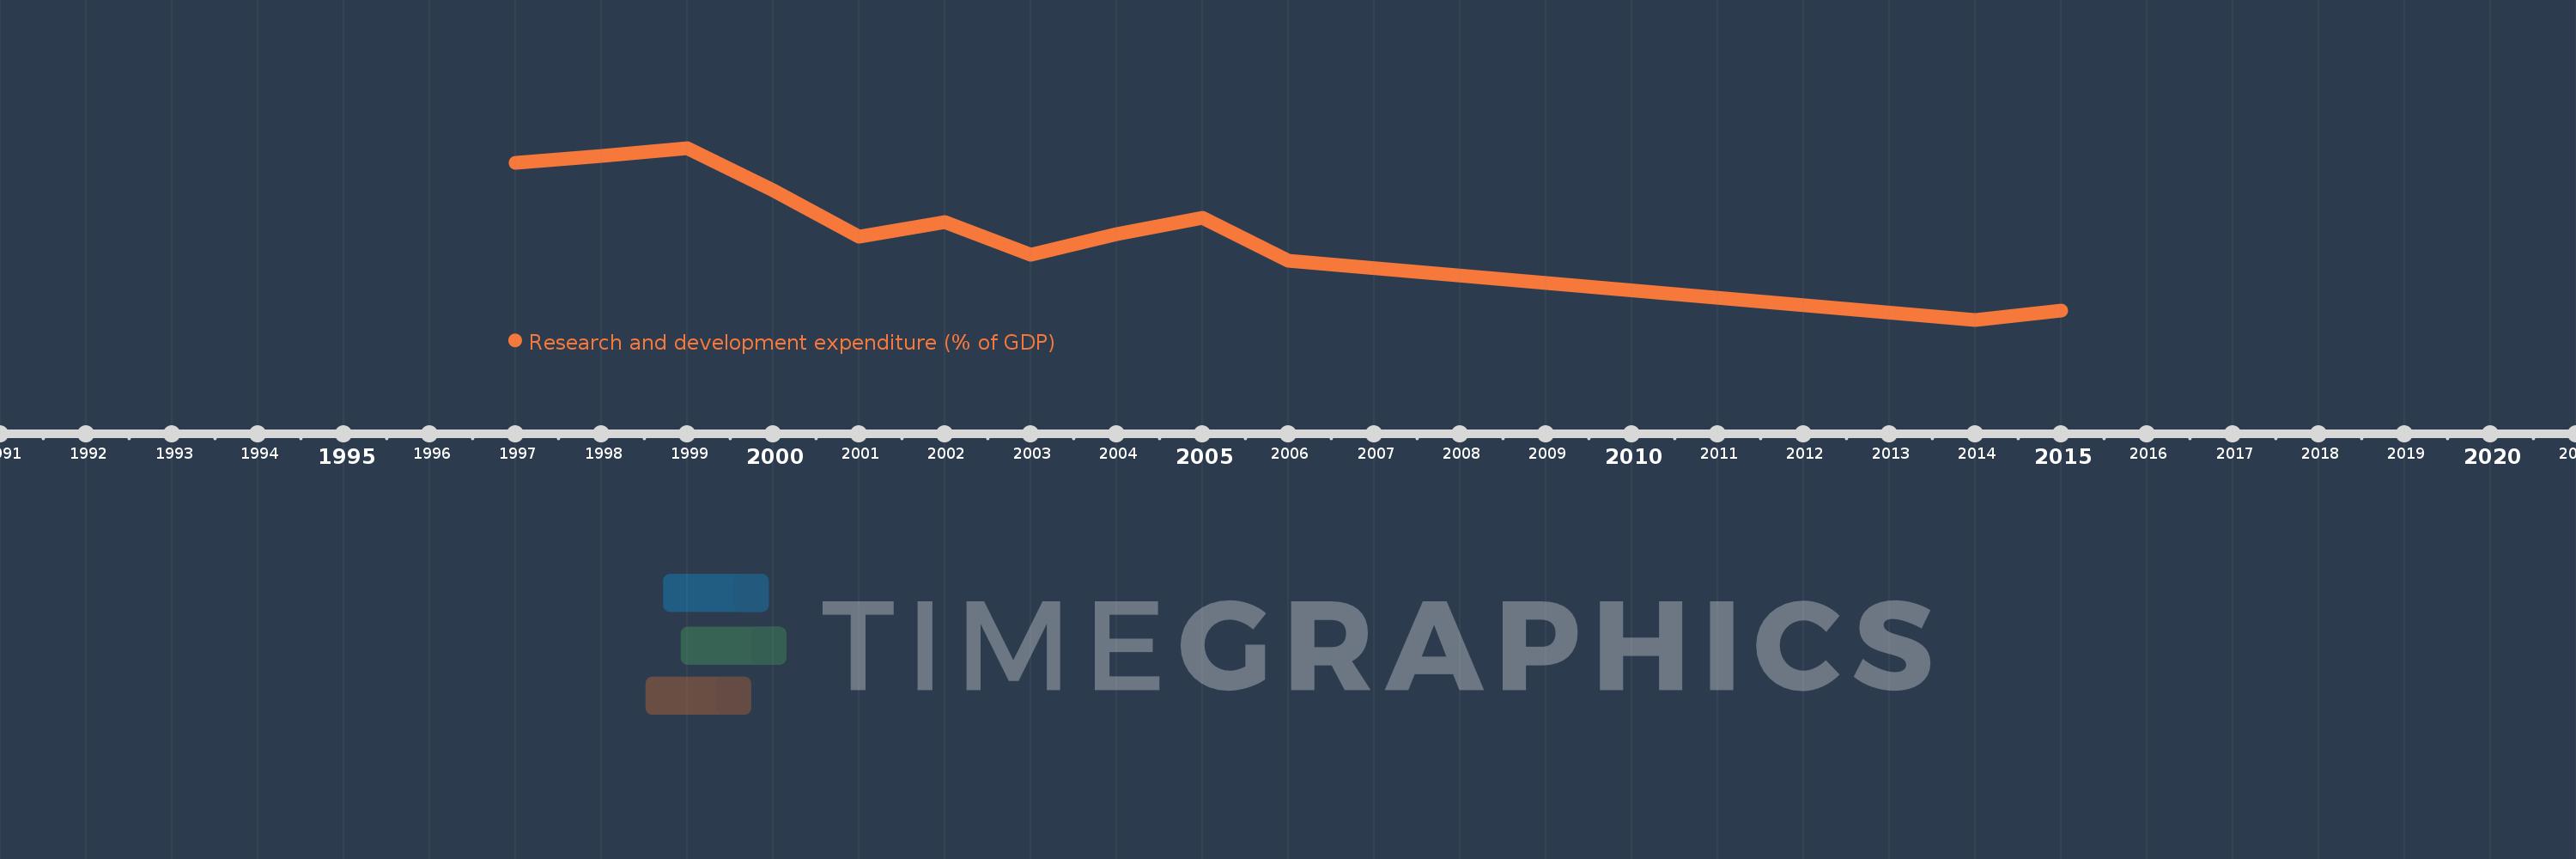
Research and development expenditure (% of GDP)
2015,2014,2006,2005,2004,2003,2002,2001,2000,1999,1998,1997
This statistics in other country:
Timeline:
This timeline shows a graph from 1997 to 2015 of Georgia. No data until 1996. Number of actual observations by date: 12.
Source name:
World Development Indicators
Source organization:
United Nations Educational, Scientific, and Cultural Organization (UNESCO) Institute for Statistics.
Categories, topics:
Science & Technology
Last updated:
apr 23, 2017
Indicators value changes by year
At the date of observation
Value
Absolute change
Change from previous value
jan 1, 1997
0.331
+0.331
0.0%
jan 1, 1998
0.342
+0.012
3.48%
jan 1, 1999
0.354
+0.011
3.34%
jan 1, 2000
0.288
-0.066
-18.69%
jan 1, 2001
0.215
-0.072
-25.16%
jan 1, 2002
0.238
+0.023
10.77%
jan 1, 2003
0.186
-0.053
-22.12%
jan 1, 2004
0.218
+0.032
17.15%
jan 1, 2005
0.244
+0.027
12.22%
jan 1, 2006
0.177
-0.068
-27.69%
jan 1, 2014
0.084
-0.093
-52.62%
jan 1, 2015
0.098
+0.015
17.64%
Ranking of countries by current statistics by years


Comments: