29
/
en
AIzaSyAYiBZKx7MnpbEhh9jyipgxe19OcubqV5w
April 1, 2024
74348
Austria
AUT
true
2
1
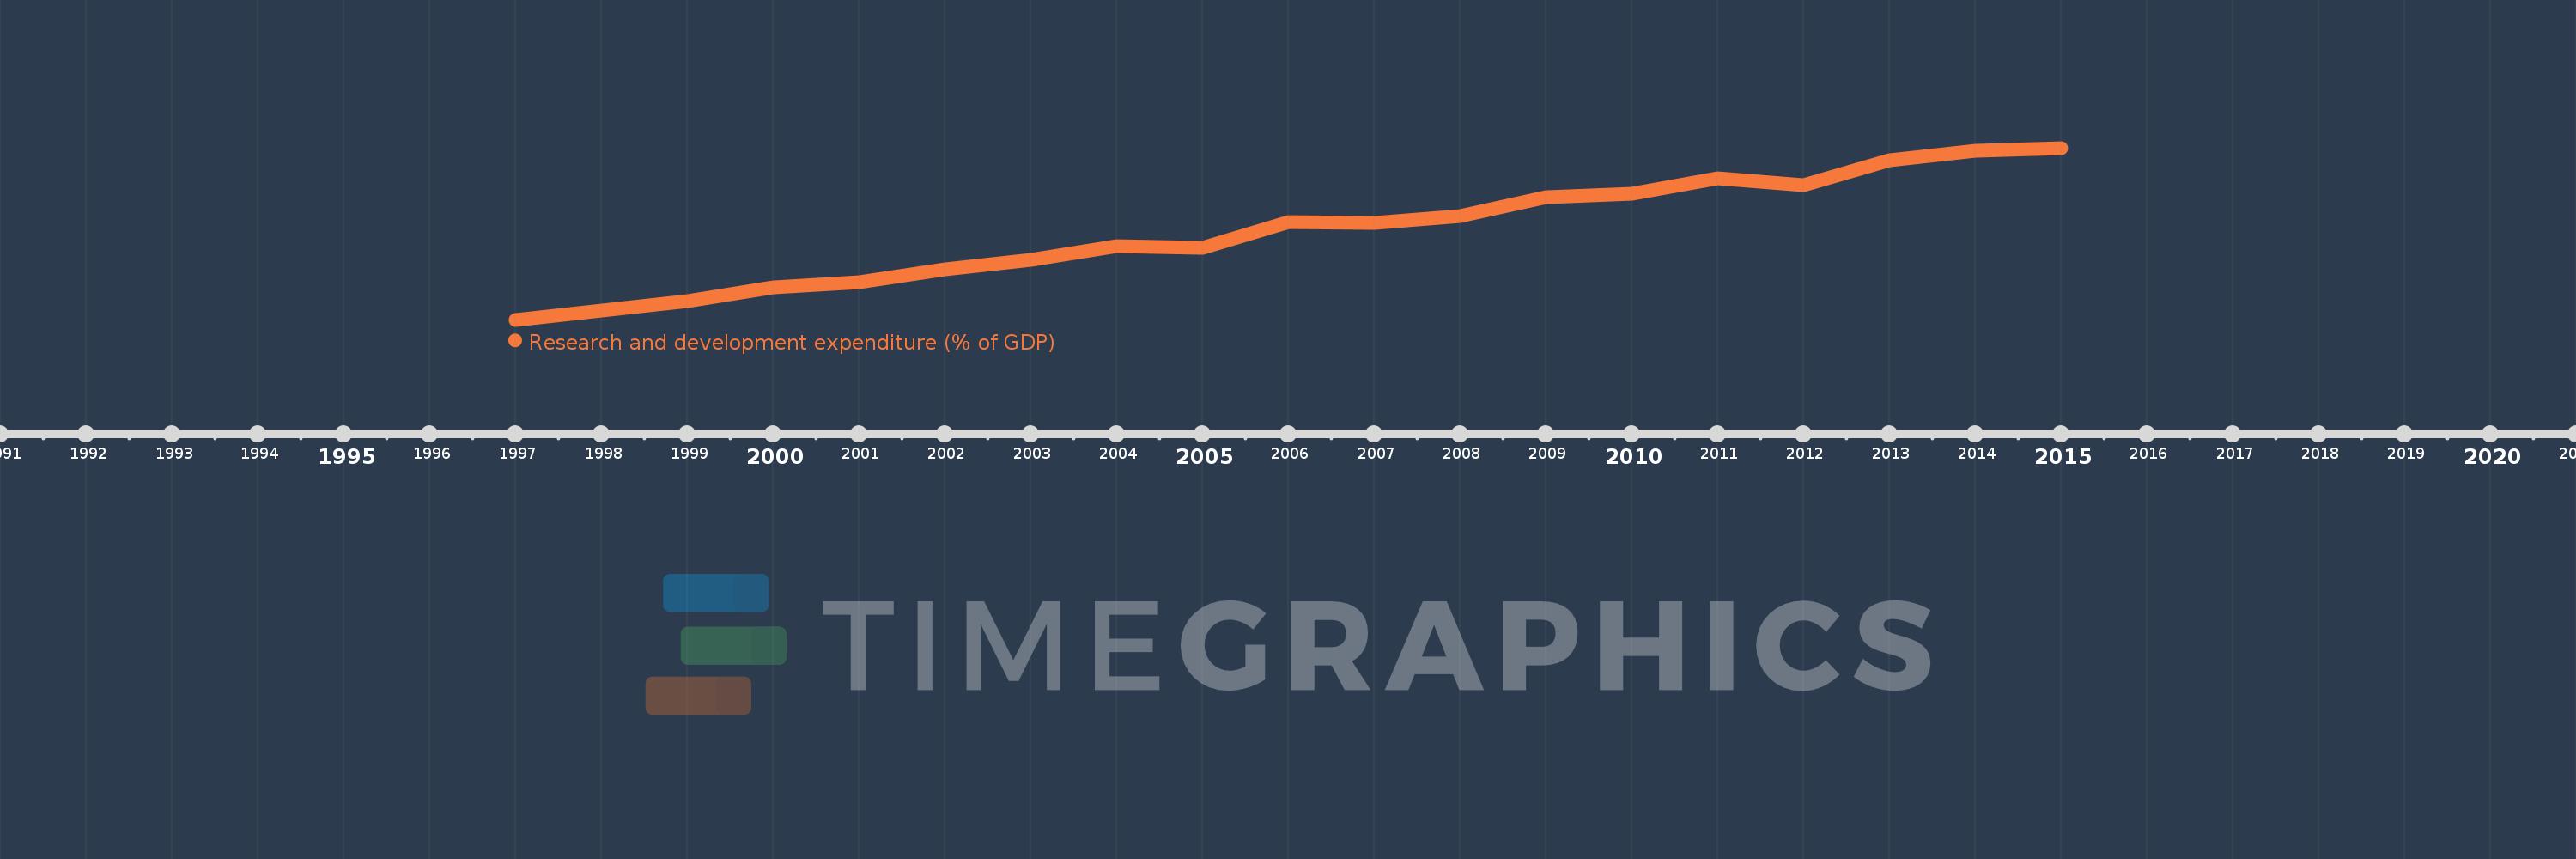
Research and development expenditure (% of GDP)
2015,2014,2013,2012,2011,2010,2009,2008,2007,2006,2005,2004,2003,2002,2001,2000,1999,1998,1997
This statistics in other country:
Timeline:
This timeline shows a graph from 1997 to 2015 of Austria. No data until 1996. Number of actual observations by date: 19.
Source name:
World Development Indicators
Source organization:
United Nations Educational, Scientific, and Cultural Organization (UNESCO) Institute for Statistics.
Categories, topics:
Science & Technology
Last updated:
apr 23, 2017
Indicators value changes by year
At the date of observation
Value
Absolute change
Change from previous value
jan 1, 1997
1.584
+1.584
0.0%
jan 1, 1998
1.659
+0.074
4.69%
jan 1, 1999
1.736
+0.078
4.68%
jan 1, 2000
1.849
+0.113
6.52%
jan 1, 2001
1.89
+0.04
2.18%
jan 1, 2002
1.996
+0.106
5.63%
jan 1, 2003
2.07
+0.074
3.7%
jan 1, 2004
2.183
+0.113
5.45%
jan 1, 2005
2.174
-0.009
-0.41%
jan 1, 2006
2.383
+0.21
9.64%
jan 1, 2007
2.371
-0.012
-0.51%
jan 1, 2008
2.432
+0.061
2.58%
jan 1, 2009
2.586
+0.153
6.3%
jan 1, 2010
2.614
+0.028
1.08%
jan 1, 2011
2.738
+0.124
4.75%
jan 1, 2012
2.682
-0.056
-2.05%
jan 1, 2013
2.886
+0.204
7.61%
jan 1, 2014
2.964
+0.079
2.73%
jan 1, 2015
2.986
+0.022
0.73%
Ranking of countries by current statistics by years


Comments: