29
/
en
AIzaSyAYiBZKx7MnpbEhh9jyipgxe19OcubqV5w
April 1, 2024
81200
Belarus
BLR
true
2
1
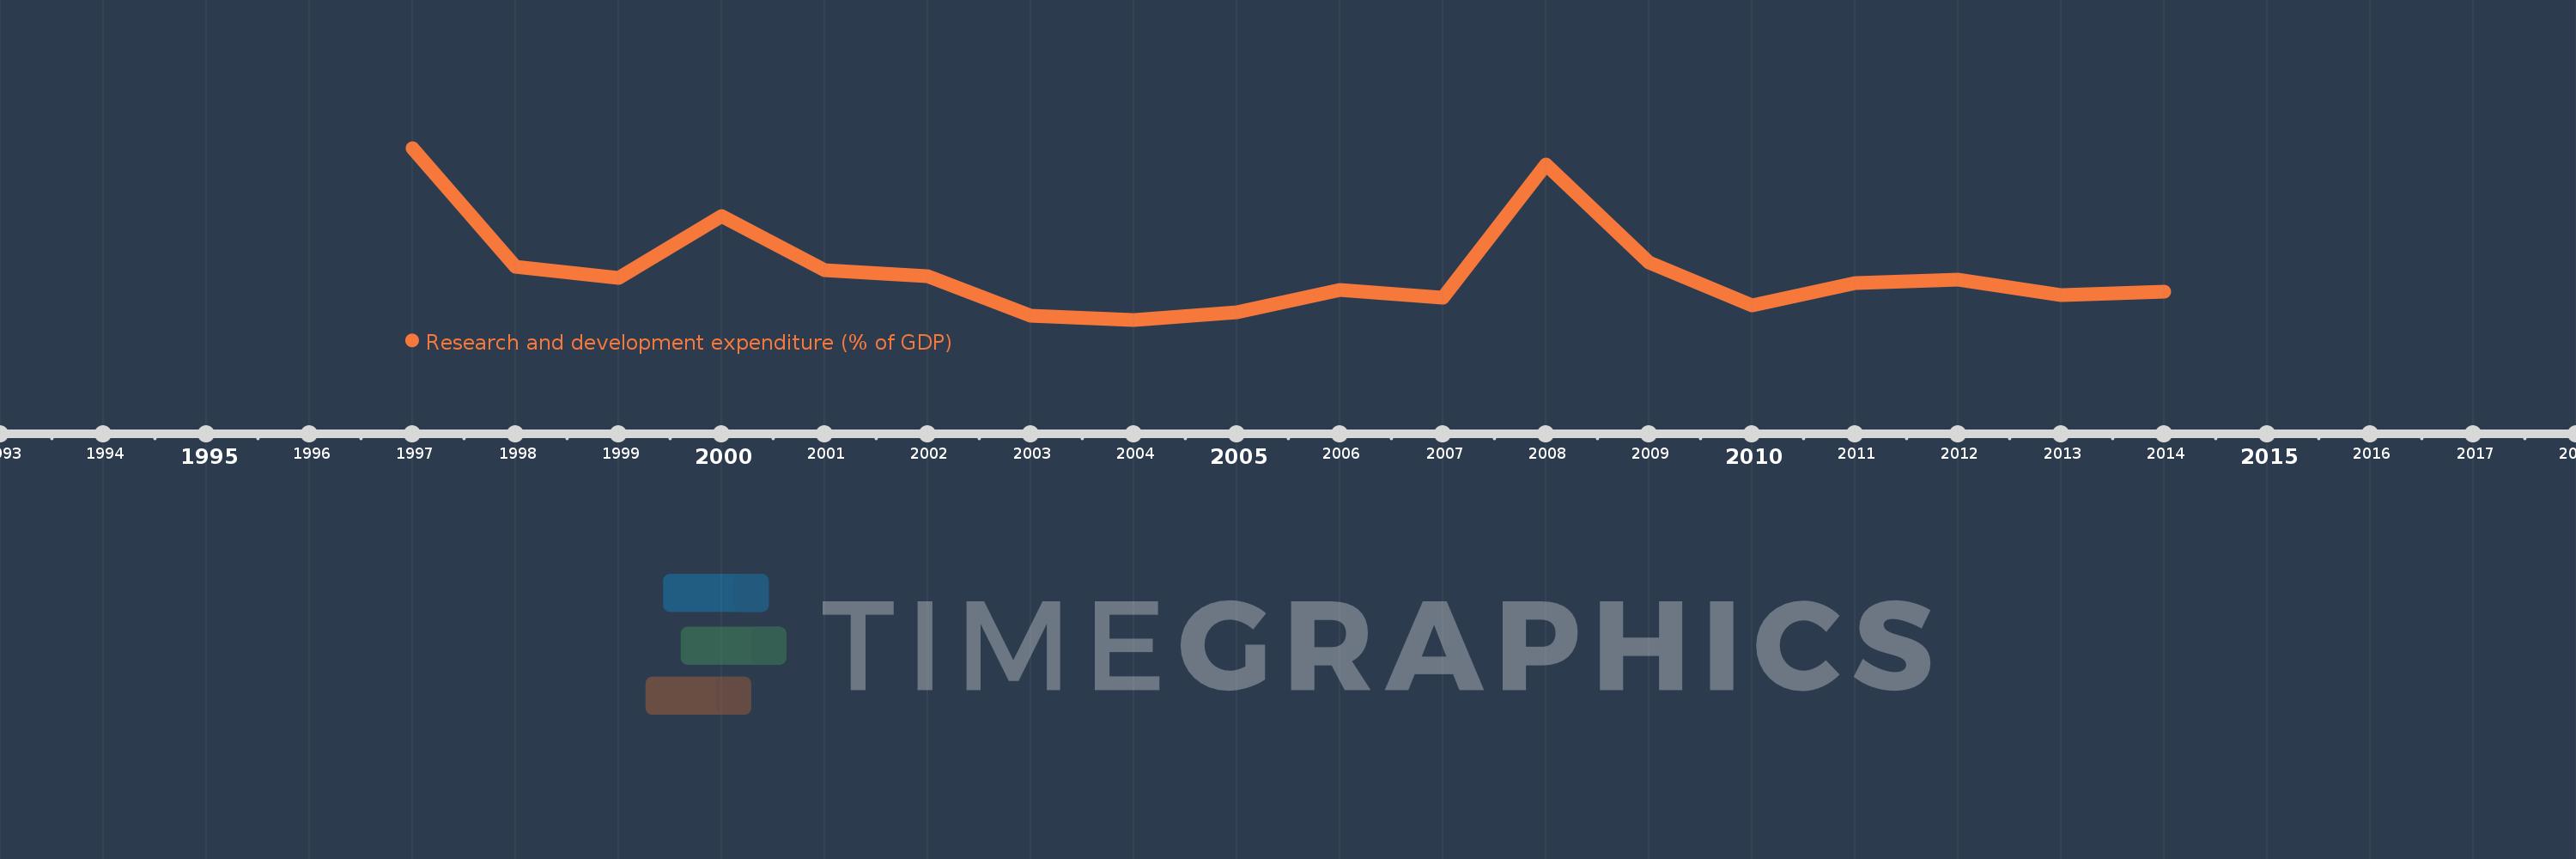
Research and development expenditure (% of GDP)
2014,2013,2012,2011,2010,2009,2008,2007,2006,2005,2004,2003,2002,2001,2000,1999,1998,1997
This statistics in other country:
Timeline:
This timeline shows a graph from 1997 to 2014 of Belarus. No data until 1996. Number of actual observations by date: 18.
Source name:
World Development Indicators
Source organization:
United Nations Educational, Scientific, and Cultural Organization (UNESCO) Institute for Statistics.
Categories, topics:
Science & Technology
Last updated:
apr 23, 2017
Indicators value changes by year
At the date of observation
Value
Absolute change
Change from previous value
jan 1, 1997
0.999
+0.999
0.0%
jan 1, 1998
0.73
-0.269
-26.89%
jan 1, 1999
0.706
-0.024
-3.32%
jan 1, 2000
0.845
+0.139
19.76%
jan 1, 2001
0.722
-0.123
-14.57%
jan 1, 2002
0.709
-0.013
-1.85%
jan 1, 2003
0.621
-0.088
-12.4%
jan 1, 2004
0.611
-0.009
-1.52%
jan 1, 2005
0.628
+0.016
2.64%
jan 1, 2006
0.679
+0.051
8.12%
jan 1, 2007
0.661
-0.018
-2.63%
jan 1, 2008
0.962
+0.301
45.62%
jan 1, 2009
0.741
-0.221
-22.93%
jan 1, 2010
0.643
-0.099
-13.32%
jan 1, 2011
0.693
+0.051
7.91%
jan 1, 2012
0.701
+0.007
1.02%
jan 1, 2013
0.667
-0.034
-4.79%
jan 1, 2014
0.674
+0.007
0.98%
Ranking of countries by current statistics by years


Comments: