29
/
en
AIzaSyAYiBZKx7MnpbEhh9jyipgxe19OcubqV5w
April 1, 2024
182514
Luxembourg
LUX
true
2
1
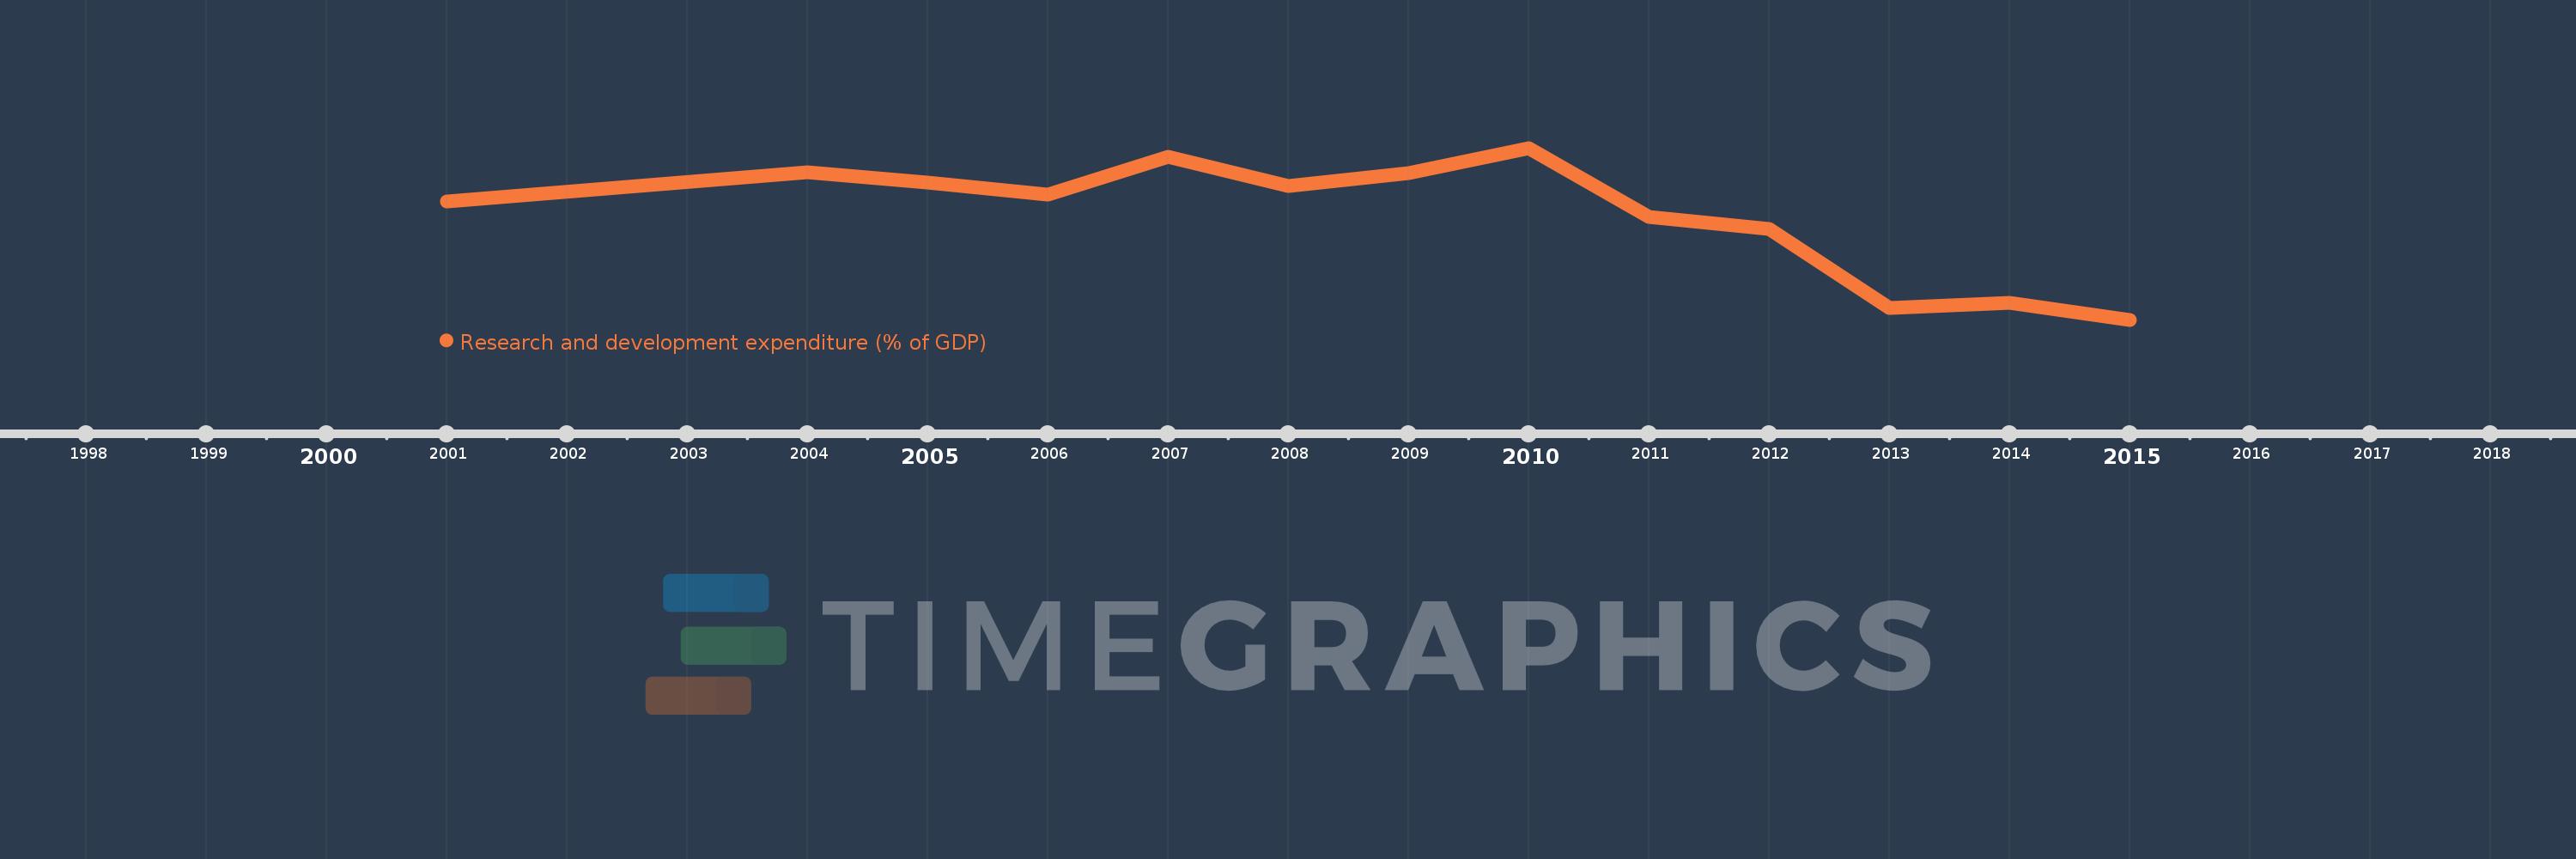
Research and development expenditure (% of GDP)
2015,2014,2013,2012,2011,2010,2009,2008,2007,2006,2005,2004,2001
This statistics in other country:
Timeline:
This timeline shows a graph from 2001 to 2015 of Luxembourg. No data until 2000. Number of actual observations by date: 13.
Source name:
World Development Indicators
Source organization:
United Nations Educational, Scientific, and Cultural Organization (UNESCO) Institute for Statistics.
Categories, topics:
Science & Technology
Last updated:
apr 23, 2017
Indicators value changes by year
At the date of observation
Value
Absolute change
Change from previous value
jan 1, 2001
1.568
+1.568
0.0%
jan 1, 2004
1.645
+0.077
4.91%
jan 1, 2005
1.619
-0.027
-1.64%
jan 1, 2006
1.587
-0.031
-1.92%
jan 1, 2007
1.687
+0.099
6.25%
jan 1, 2008
1.609
-0.078
-4.6%
jan 1, 2009
1.644
+0.035
2.15%
jan 1, 2010
1.71
+0.067
4.05%
jan 1, 2011
1.527
-0.183
-10.69%
jan 1, 2012
1.495
-0.032
-2.1%
jan 1, 2013
1.288
-0.207
-13.84%
jan 1, 2014
1.301
+0.013
1.01%
jan 1, 2015
1.256
-0.045
-3.48%
Ranking of countries by current statistics by years


Comments: