29
/
en
AIzaSyAYiBZKx7MnpbEhh9jyipgxe19OcubqV5w
April 1, 2024
115321
Croatia
HRV
true
2
1
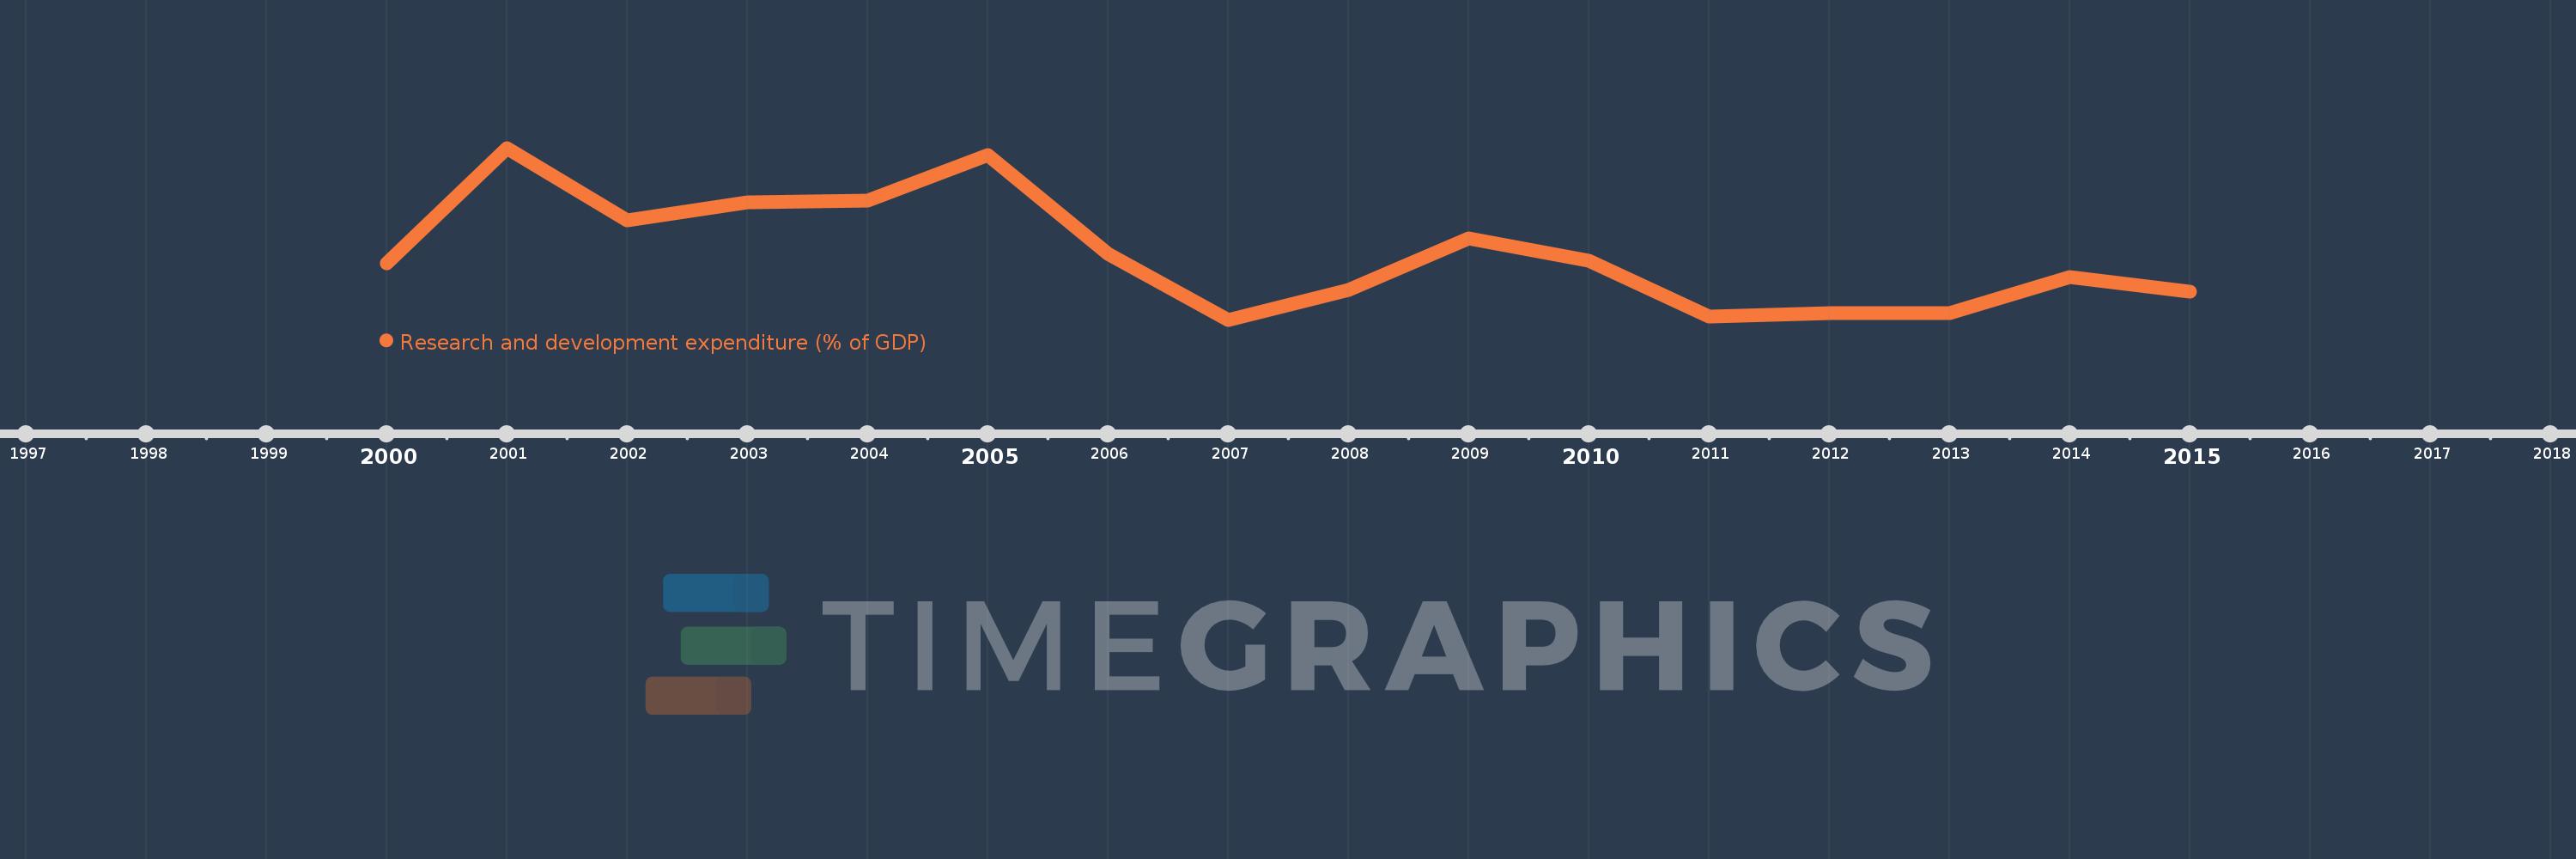
Research and development expenditure (% of GDP)
2015,2014,2013,2012,2011,2010,2009,2008,2007,2006,2005,2004,2003,2002,2001,2000
This statistics in other country:
Timeline:
This timeline shows a graph from 2000 to 2015 of Croatia. No data until 1999. Number of actual observations by date: 16.
Source name:
World Development Indicators
Source organization:
United Nations Educational, Scientific, and Cultural Organization (UNESCO) Institute for Statistics.
Categories, topics:
Science & Technology
Last updated:
apr 23, 2017
Indicators value changes by year
At the date of observation
Value
Absolute change
Change from previous value
jan 1, 2000
0.84
+0.84
0.0%
jan 1, 2001
1.044
+0.204
24.24%
jan 1, 2002
0.916
-0.128
-12.23%
jan 1, 2003
0.948
+0.032
3.46%
jan 1, 2004
0.951
+0.002
0.26%
jan 1, 2005
1.031
+0.08
8.44%
jan 1, 2006
0.856
-0.175
-17.0%
jan 1, 2007
0.74
-0.115
-13.5%
jan 1, 2008
0.792
+0.052
7.05%
jan 1, 2009
0.884
+0.092
11.6%
jan 1, 2010
0.844
-0.04
-4.51%
jan 1, 2011
0.745
-0.1
-11.79%
jan 1, 2012
0.752
+0.008
1.03%
jan 1, 2013
0.751
-0.001
-0.16%
jan 1, 2014
0.816
+0.064
8.58%
jan 1, 2015
0.79
-0.026
-3.14%
Ranking of countries by current statistics by years


Comments: