29
/
en
AIzaSyAYiBZKx7MnpbEhh9jyipgxe19OcubqV5w
April 1, 2024
199815
Mongolia
MNG
true
2
1
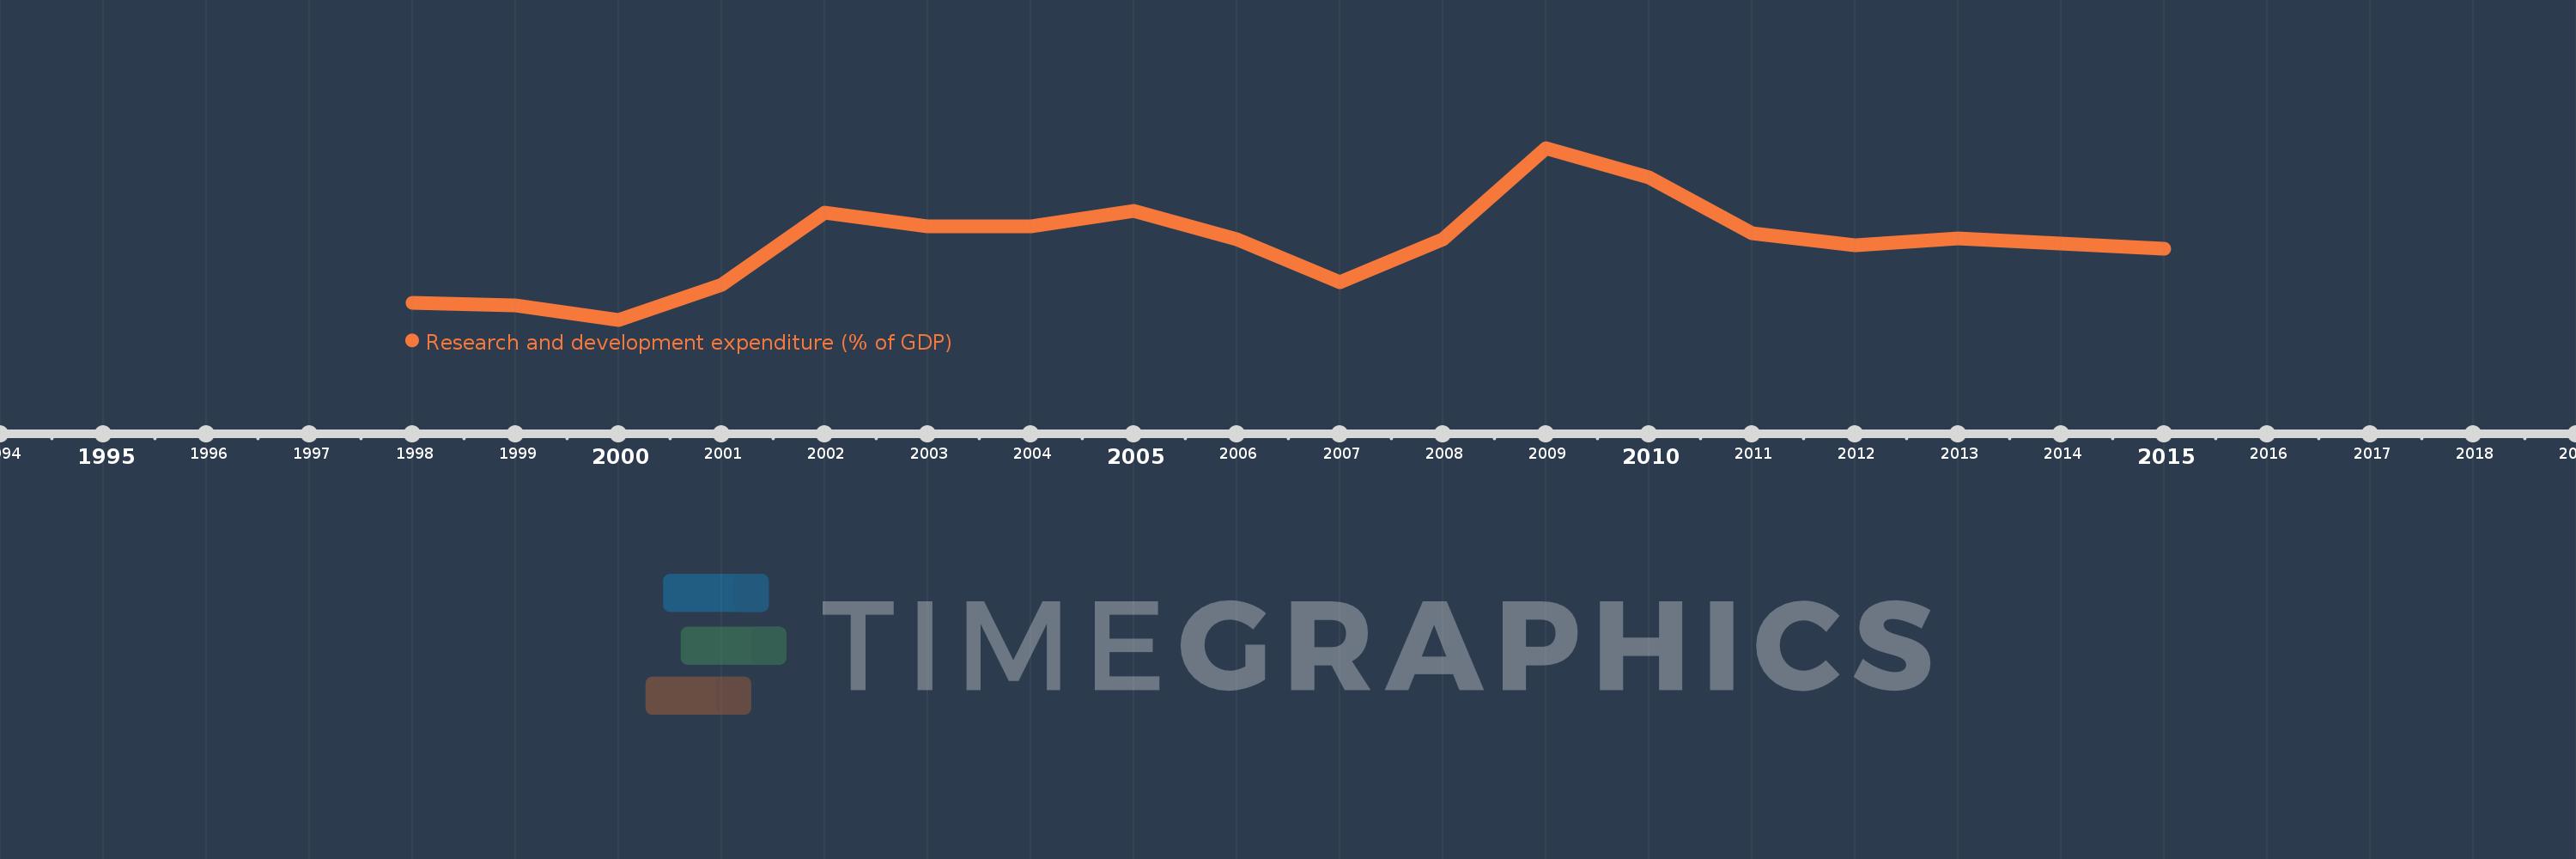
Research and development expenditure (% of GDP)
2015,2014,2013,2012,2011,2010,2009,2008,2007,2006,2005,2004,2003,2002,2001,2000,1999,1998
This statistics in other country:
Timeline:
This timeline shows a graph from 1998 to 2015 of Mongolia. No data until 1997. Number of actual observations by date: 18.
Source name:
World Development Indicators
Source organization:
United Nations Educational, Scientific, and Cultural Organization (UNESCO) Institute for Statistics.
Categories, topics:
Science & Technology
Last updated:
apr 23, 2017
Indicators value changes by year
At the date of observation
Value
Absolute change
Change from previous value
jan 1, 1998
0.168
+0.168
0.0%
jan 1, 1999
0.166
-0.001
-0.85%
jan 1, 2000
0.15
-0.016
-9.78%
jan 1, 2001
0.188
+0.037
24.91%
jan 1, 2002
0.267
+0.08
42.61%
jan 1, 2003
0.252
-0.016
-5.89%
jan 1, 2004
0.252
+0.0
0.03%
jan 1, 2005
0.268
+0.016
6.34%
jan 1, 2006
0.238
-0.03
-11.21%
jan 1, 2007
0.191
-0.047
-19.58%
jan 1, 2008
0.238
+0.047
24.61%
jan 1, 2009
0.337
+0.098
41.3%
jan 1, 2010
0.305
-0.032
-9.47%
jan 1, 2011
0.244
-0.06
-19.82%
jan 1, 2012
0.231
-0.014
-5.66%
jan 1, 2013
0.239
+0.009
3.73%
jan 1, 2014
0.233
-0.006
-2.5%
jan 1, 2015
0.227
-0.006
-2.5%
Ranking of countries by current statistics by years


Comments: