29
/
en
AIzaSyAYiBZKx7MnpbEhh9jyipgxe19OcubqV5w
April 1, 2024
256782
Sweden
SWE
true
2
1
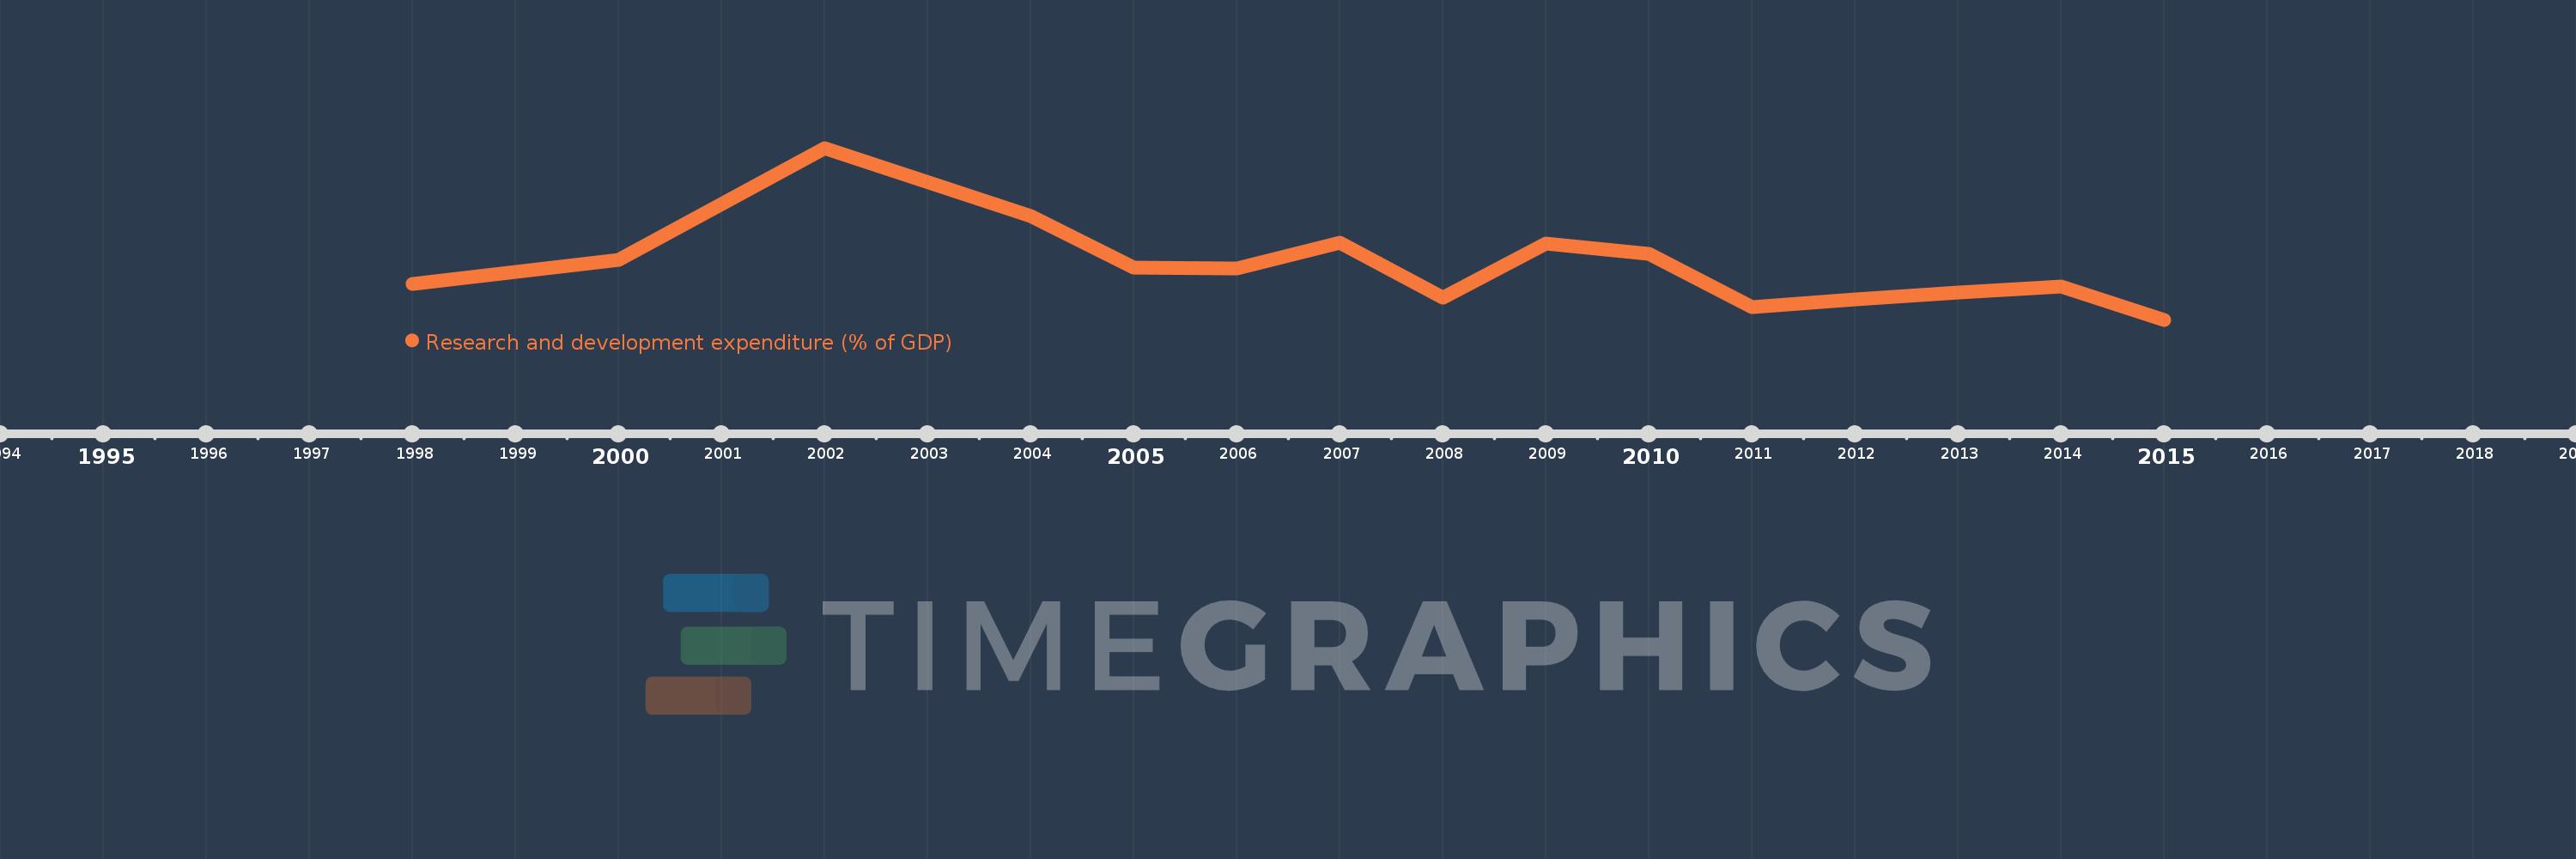
Research and development expenditure (% of GDP)
2015,2014,2013,2012,2011,2010,2009,2008,2007,2006,2005,2004,2002,2000,1998
This statistics in other country:
Timeline:
This timeline shows a graph from 1998 to 2015 of Sweden. No data until 1997. Number of actual observations by date: 15.
Source name:
World Development Indicators
Source organization:
United Nations Educational, Scientific, and Cultural Organization (UNESCO) Institute for Statistics.
Categories, topics:
Science & Technology
Last updated:
apr 23, 2017
Indicators value changes by year
At the date of observation
Value
Absolute change
Change from previous value
jan 1, 1998
3.319
+3.319
0.0%
jan 1, 2000
3.422
+0.102
3.08%
jan 1, 2002
3.914
+0.492
14.39%
jan 1, 2004
3.614
-0.299
-7.65%
jan 1, 2005
3.391
-0.223
-6.17%
jan 1, 2006
3.387
-0.004
-0.13%
jan 1, 2007
3.5
+0.113
3.35%
jan 1, 2008
3.257
-0.244
-6.96%
jan 1, 2009
3.495
+0.239
7.33%
jan 1, 2010
3.45
-0.046
-1.3%
jan 1, 2011
3.216
-0.234
-6.77%
jan 1, 2012
3.249
+0.033
1.03%
jan 1, 2013
3.281
+0.032
0.99%
jan 1, 2014
3.306
+0.025
0.75%
jan 1, 2015
3.161
-0.145
-4.39%
Ranking of countries by current statistics by years


Comments: