29
/
en
AIzaSyAYiBZKx7MnpbEhh9jyipgxe19OcubqV5w
April 1, 2024
183290
Macao SAR, China
MAC
true
2
1
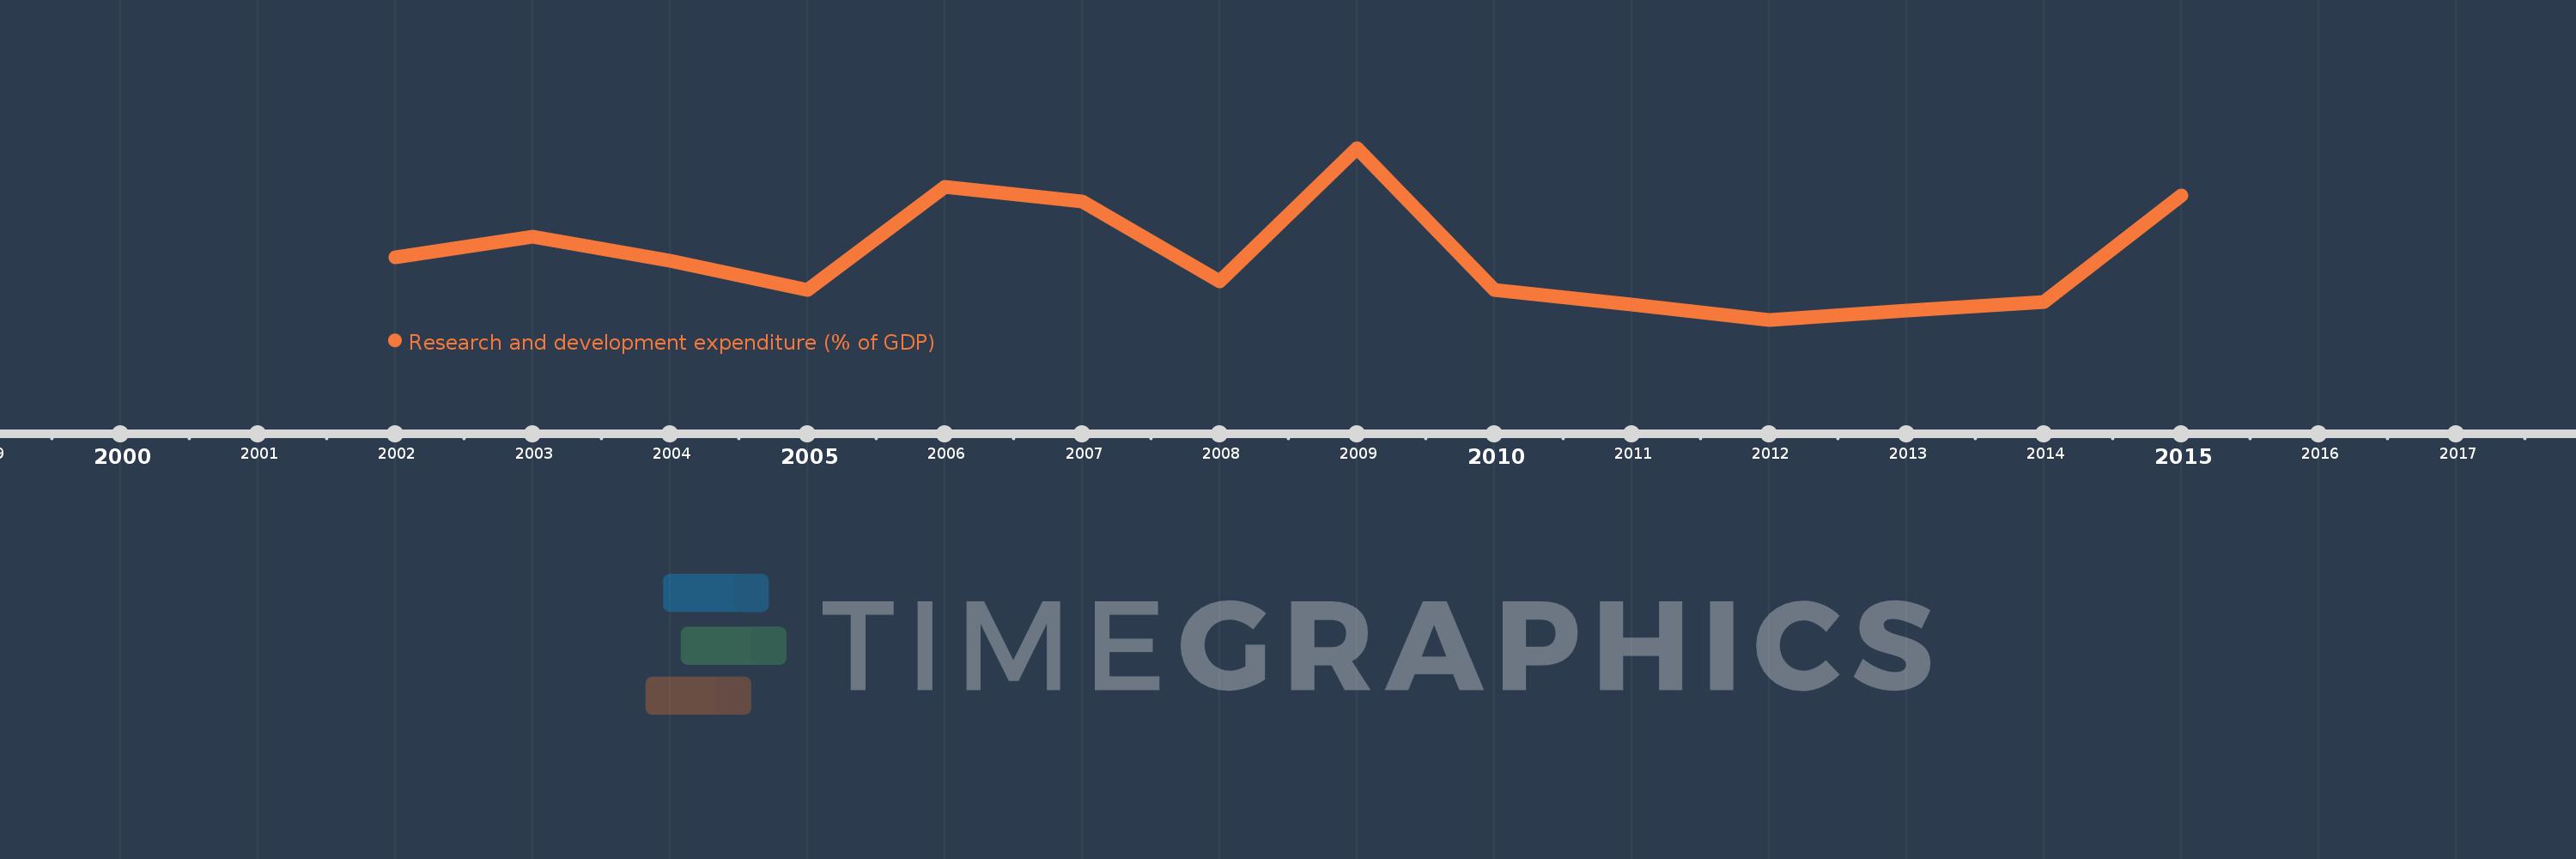
Research and development expenditure (% of GDP)
2015,2014,2013,2012,2011,2010,2009,2008,2007,2006,2005,2004,2003,2002
This statistics in other country:
Timeline:
This timeline shows a graph from 2002 to 2015 of Macao SAR, China. No data until 2001. Number of actual observations by date: 14.
Source name:
World Development Indicators
Source organization:
United Nations Educational, Scientific, and Cultural Organization (UNESCO) Institute for Statistics.
Categories, topics:
Science & Technology
Last updated:
apr 23, 2017
Indicators value changes by year
At the date of observation
Value
Absolute change
Change from previous value
jan 1, 2002
0.066
+0.066
0.0%
jan 1, 2003
0.073
+0.008
11.66%
jan 1, 2004
0.065
-0.008
-11.23%
jan 1, 2005
0.055
-0.01
-14.64%
jan 1, 2006
0.09
+0.035
62.9%
jan 1, 2007
0.085
-0.006
-6.31%
jan 1, 2008
0.058
-0.027
-31.4%
jan 1, 2009
0.103
+0.044
76.56%
jan 1, 2010
0.055
-0.048
-46.57%
jan 1, 2011
0.05
-0.005
-8.87%
jan 1, 2012
0.045
-0.005
-10.78%
jan 1, 2013
0.048
+0.004
8.04%
jan 1, 2014
0.051
+0.003
6.82%
jan 1, 2015
0.087
+0.035
68.92%
Ranking of countries by current statistics by years


Comments: