29
/
en
AIzaSyAYiBZKx7MnpbEhh9jyipgxe19OcubqV5w
April 1, 2024
125482
Egypt, Arab Rep.
EGY
true
2
1
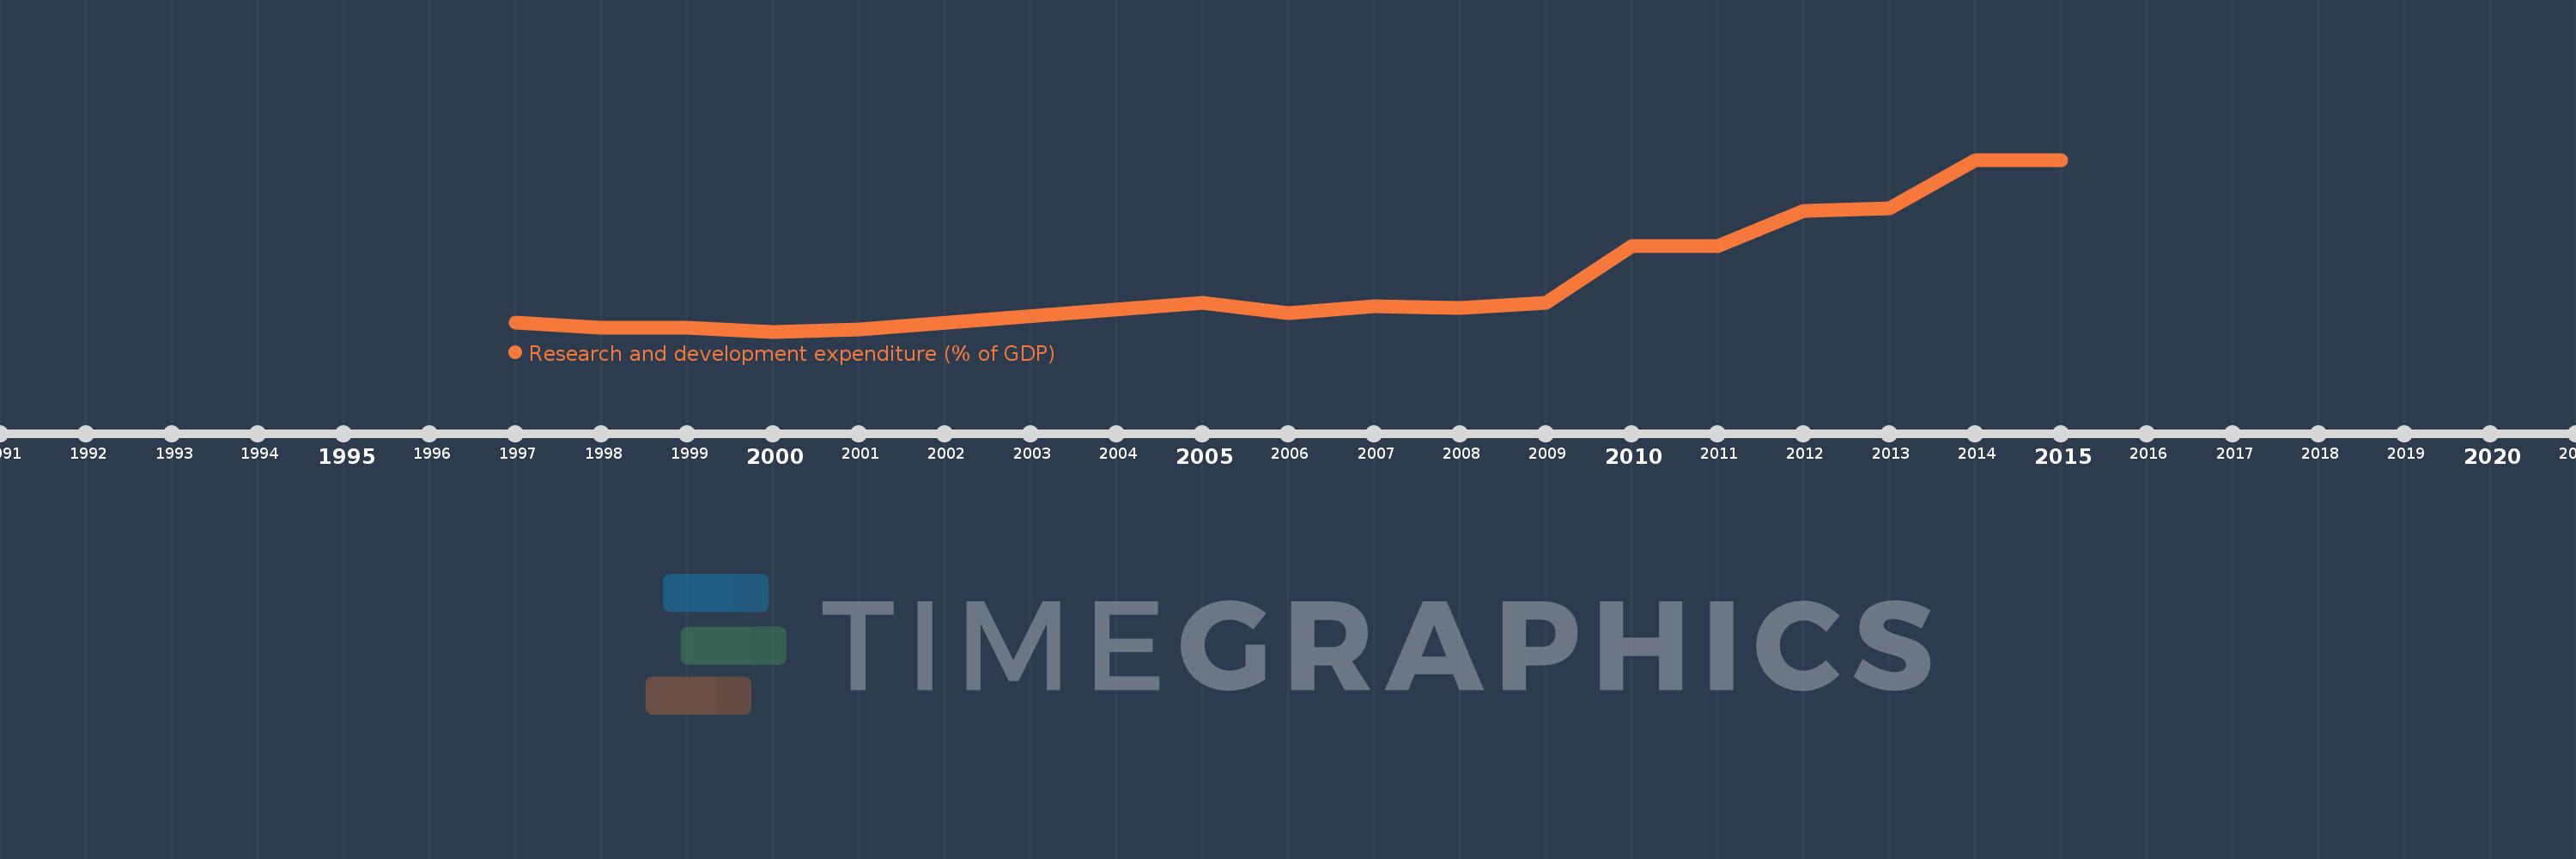
Research and development expenditure (% of GDP)
2015,2014,2013,2012,2011,2010,2009,2008,2007,2006,2005,2001,2000,1999,1998,1997
This statistics in other country:
Timeline:
This timeline shows a graph from 1997 to 2015 of Egypt, Arab Rep.. No data until 1996. Number of actual observations by date: 16.
Source name:
World Development Indicators
Source organization:
United Nations Educational, Scientific, and Cultural Organization (UNESCO) Institute for Statistics.
Categories, topics:
Science & Technology
Last updated:
apr 23, 2017
Indicators value changes by year
At the date of observation
Value
Absolute change
Change from previous value
jan 1, 1997
0.213
+0.213
0.0%
jan 1, 1998
0.198
-0.015
-7.07%
jan 1, 1999
0.199
+0.002
0.78%
jan 1, 2000
0.187
-0.013
-6.32%
jan 1, 2001
0.192
+0.006
3.2%
jan 1, 2005
0.27
+0.077
40.25%
jan 1, 2006
0.241
-0.029
-10.57%
jan 1, 2007
0.259
+0.018
7.3%
jan 1, 2008
0.255
-0.004
-1.52%
jan 1, 2009
0.27
+0.015
5.93%
jan 1, 2010
0.433
+0.163
60.27%
jan 1, 2011
0.433
+0.0
0.08%
jan 1, 2012
0.532
+0.098
22.63%
jan 1, 2013
0.541
+0.009
1.79%
jan 1, 2014
0.678
+0.137
25.31%
jan 1, 2015
0.679
+0.001
0.1%
Ranking of countries by current statistics by years


Comments: