29
/
en
AIzaSyAYiBZKx7MnpbEhh9jyipgxe19OcubqV5w
April 1, 2024
240918
Singapore
SGP
true
2
1
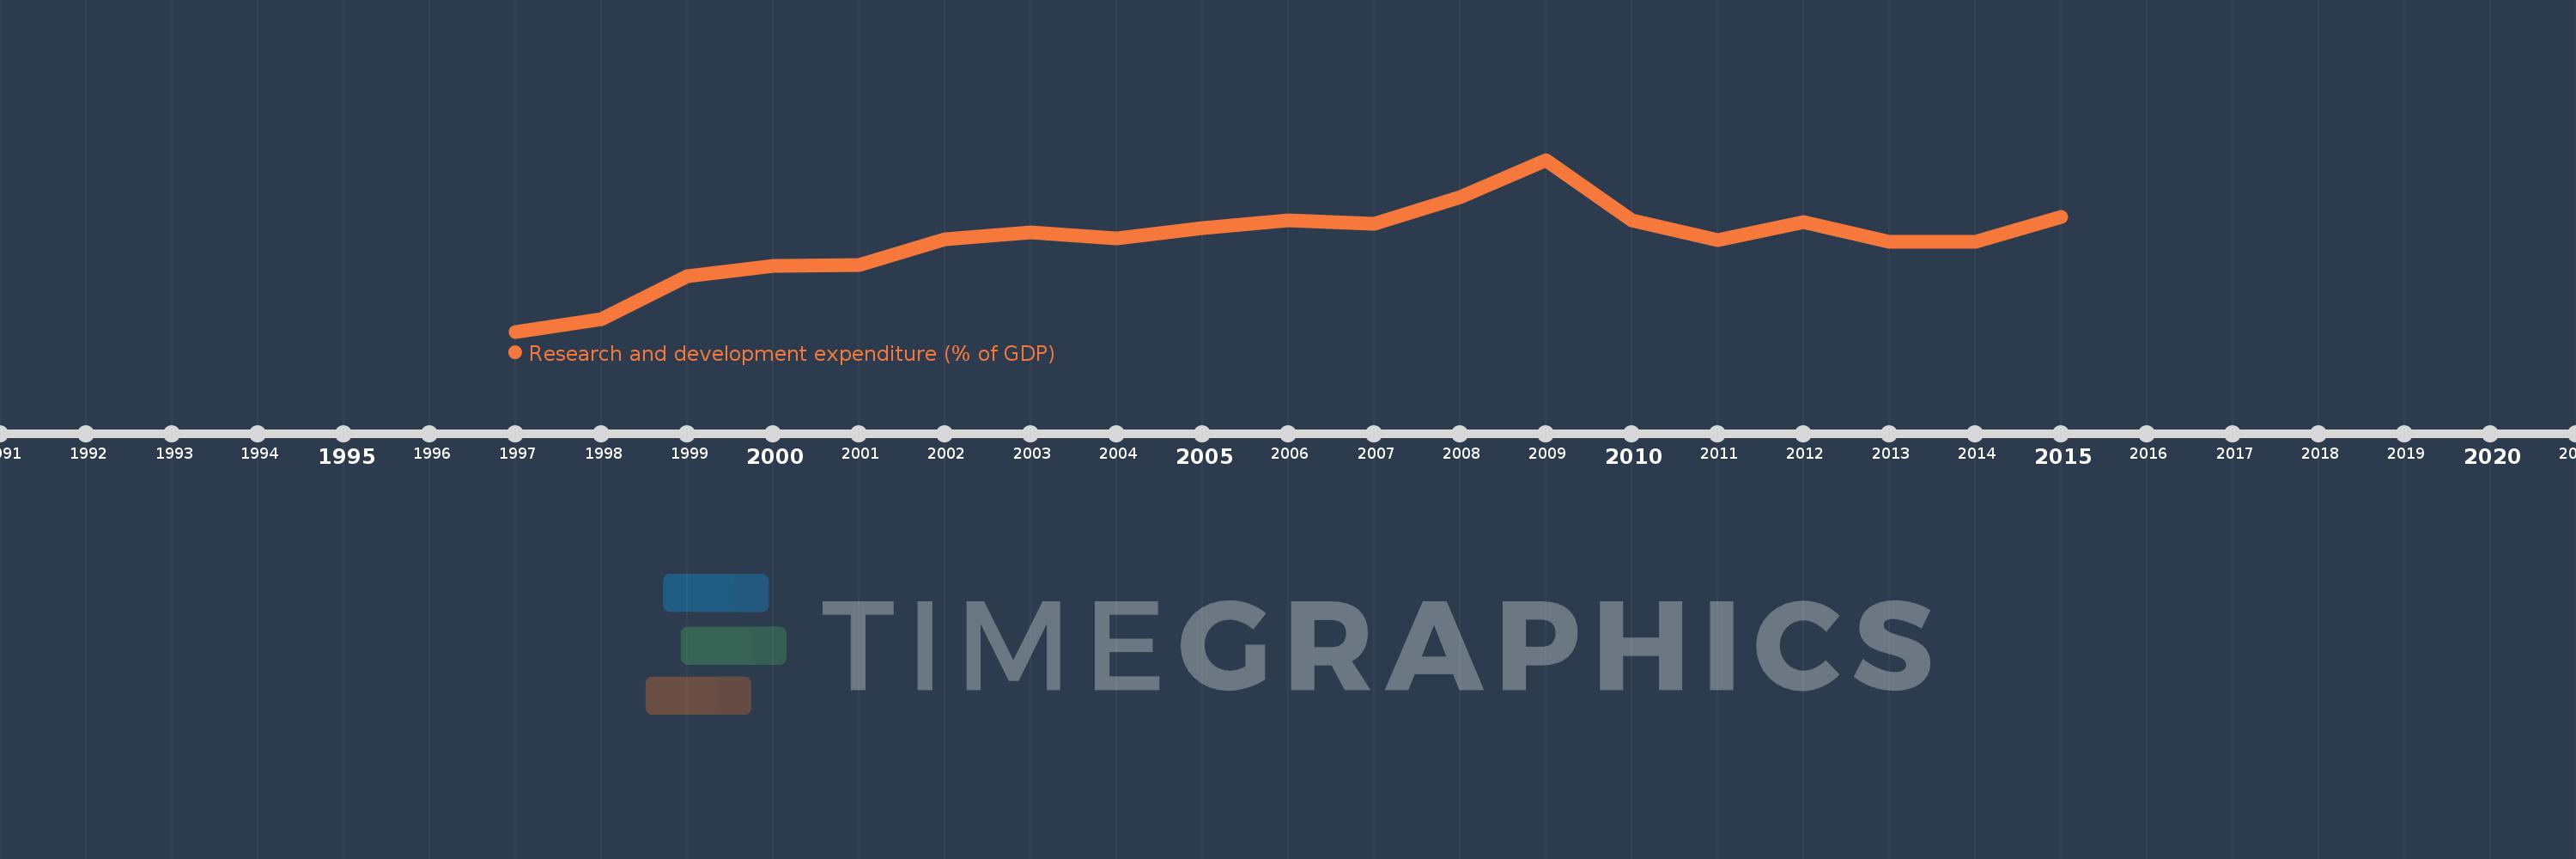
Research and development expenditure (% of GDP)
2015,2014,2013,2012,2011,2010,2009,2008,2007,2006,2005,2004,2003,2002,2001,2000,1999,1998,1997
This statistics in other country:
Timeline:
This timeline shows a graph from 1997 to 2015 of Singapore. No data until 1996. Number of actual observations by date: 19.
Source name:
World Development Indicators
Source organization:
United Nations Educational, Scientific, and Cultural Organization (UNESCO) Institute for Statistics.
Categories, topics:
Science & Technology
Last updated:
apr 23, 2017
Indicators value changes by year
At the date of observation
Value
Absolute change
Change from previous value
jan 1, 1997
1.318
+1.318
0.0%
jan 1, 1998
1.415
+0.097
7.33%
jan 1, 1999
1.737
+0.322
22.78%
jan 1, 2000
1.816
+0.079
4.53%
jan 1, 2001
1.822
+0.005
0.29%
jan 1, 2002
2.021
+0.199
10.94%
jan 1, 2003
2.068
+0.047
2.34%
jan 1, 2004
2.026
-0.042
-2.02%
jan 1, 2005
2.105
+0.078
3.86%
jan 1, 2006
2.161
+0.056
2.66%
jan 1, 2007
2.133
-0.027
-1.27%
jan 1, 2008
2.337
+0.204
9.55%
jan 1, 2009
2.621
+0.284
12.15%
jan 1, 2010
2.159
-0.462
-17.61%
jan 1, 2011
2.013
-0.146
-6.77%
jan 1, 2012
2.151
+0.138
6.83%
jan 1, 2013
1.999
-0.151
-7.03%
jan 1, 2014
2.0
+0.001
0.05%
jan 1, 2015
2.186
+0.185
9.26%
Ranking of countries by current statistics by years


Comments: